

You know the shape of this problem. The Performance report is open, sorted by clicks, and one URL stands out for the wrong reason: a big pile of impressions and a click-through rate that looks like a rounding error. You rewrite the title, wait a week, and the number moves by a tenth of a point. Now you can't tell whether the rewrite failed or whether you were reading noise the whole time.
Google Search Console CTR punishes that kind of impatience, because the metric is a ratio built from two numbers that move independently. Clicks and impressions rarely travel together, and the report doesn't always show you every query sitting behind them. Read CTR as a headline and you'll rewrite titles that were already working. Read it as a ratio with a known sample size and a known blind spot, and it becomes one of the cheapest diagnostic signals in organic search.
The distinction that matters most is this: a CTR figure is only as trustworthy as the query data underneath it. Getting comfortable with that takes a few steps, and every one of them is arithmetic you can do yourself.
Table of Contents
- How Search Console Calculates CTR
- Pitfalls That Distort Your CTR
- Reading CTR Alongside Impressions and Position
- Segmenting CTR by Query, Page, Device and Country
- Checking How Much Query Data You Can See
- Tips That Lift Organic CTR
- Turn CTR Findings Into a Title Test Plan
How Search Console Calculates CTR
A page earns a chance every time its result appears in Google Search. CTR tells you how often someone takes that chance. The Google Search Console Performance report documentation defines click-through rate as clicks divided by impressions, and the worked example it uses is worth memorizing: 250 clicks from 10,000 impressions equals a CTR of 2.5%.
That's the whole formula. Multiply by 100 to express it as a percentage, or just read it as a proportion and skip the multiplication. A 5% CTR means roughly five clicks for every 100 times the result appeared.
What an impression actually counts
An impression is recorded each time your result appears for a search, so the denominator grows with every extra query and every extra page of results your URL reaches. Impressions measure exposure, not attention. A result that appears far down the page still adds to the denominator, which is why some well-ranked pages carry lower CTRs than pages sitting in the top two spots: more of their impressions come from places where nobody looks.
The Performance report places clicks, impressions, CTR and average position side by side for exactly this reason. They're designed to be read as a set, because the same percentage means different things at different volumes and different ranks.
Worked examples you can check
Take four rows and do the division yourself.
| Page | Clicks | Impressions | CTR |
|---|---|---|---|
| Homepage | 250 | 10,000 | 2.5% |
| Niche blog post | 40 | 800 | 5% |
| Five clicks per hundred impressions | 5 | 100 | 5% |
| Zero impressions | 0 | 0 | , |
The last row explains a confusion that trips people up constantly. When a row shows a dash instead of a percentage, it means the row recorded no impressions, and CTR cannot be calculated by dividing by zero. A dash is not a zero. It means there's nothing to divide.
Rule of thumb: Never quote a CTR without the impression count beside it. The percentage alone tells you nothing about how much evidence stands behind it.
A two-minute arithmetic check
Open the Performance report, set a date range, and pick one page with real traffic. Divide its clicks by its impressions over that same range, then compare the result with the CTR column. If the two match, you're reading the report correctly and everything that follows will make sense. If they don't match, a filter or a grouping level is doing something you haven't spotted yet, and that's the next problem to solve.
Pitfalls That Distort Your CTR
Here's a test that surprises many people the first time they see it. Three URLs from one site appear in the same set of search results and one click is attributed to each. Group the data by page and every URL shows a CTR of 33%. Group it by property and Google reports 100%, because the clicks get combined and the topmost position is reported. Same clicks, same impressions, two very different percentages. The Search Console data aggregation guidance uses that exact example to make a blunt point: property-level and page-level metrics are not interchangeable.
Nothing about your site changed. The grouping did.
The four ways CTR lies to you
| Pitfall | Why it distorts CTR | How to read it correctly |
|---|---|---|
| Property grouping instead of page grouping | Clicks are combined and the topmost position is reported | Compare CTR within the same grouping level |
| Comparing unequal date ranges | Seasonality and filter changes shift results | Use matched periods, such as the same weeks a year apart |
| Very few impressions | A handful of clicks swings the rate sharply | Treat small-sample CTR as a hypothesis, not a verdict |
| Zero-impression rows showing a dash | CTR cannot be calculated, so no value exists | Ignore the row rather than reading it as zero |
The sample-size trap deserves its own warning, because it's the one people describe with confident-sounding language. A page with 60 impressions and 3 clicks shows 5%. Give it one more click next week and it shows 6.7%. A page with 60,000 impressions and 3,000 clicks posts the same 5%, and a single extra click doesn't register at all. The first rate is a coin flip. The second is a measurement. Both get written into decks as "our CTR."
Anonymized queries break the totals
There's a subtler mismatch underneath the grouping issue. Chart totals include anonymized queries that never appear in the query table, and that gap widens once you apply a query filter. Export the visible rows, sum the clicks, and you won't reproduce the report's total. The CTR you calculate from the export won't match the CTR on screen either.
Size opportunities from the report totals. Use the visible query rows only to understand which titles and intents need attention. Blending the two into one homemade number produces a figure that describes neither dataset.
A CTR worth acting on is built on a large sample, compared against a matched period, and calculated inside one grouping level. Anything else is a hypothesis you haven't tested yet.
Reading CTR Alongside Impressions and Position
Think about a shop window. One on a quiet street is seen by ten people a day. One on a main road is seen by ten thousand. If both convert 5% of passers-by into walk-ins, the second shop has a business and the first has a hobby. CTR works the same way, which is why the percentage needs its reach beside it and its rank beside that.
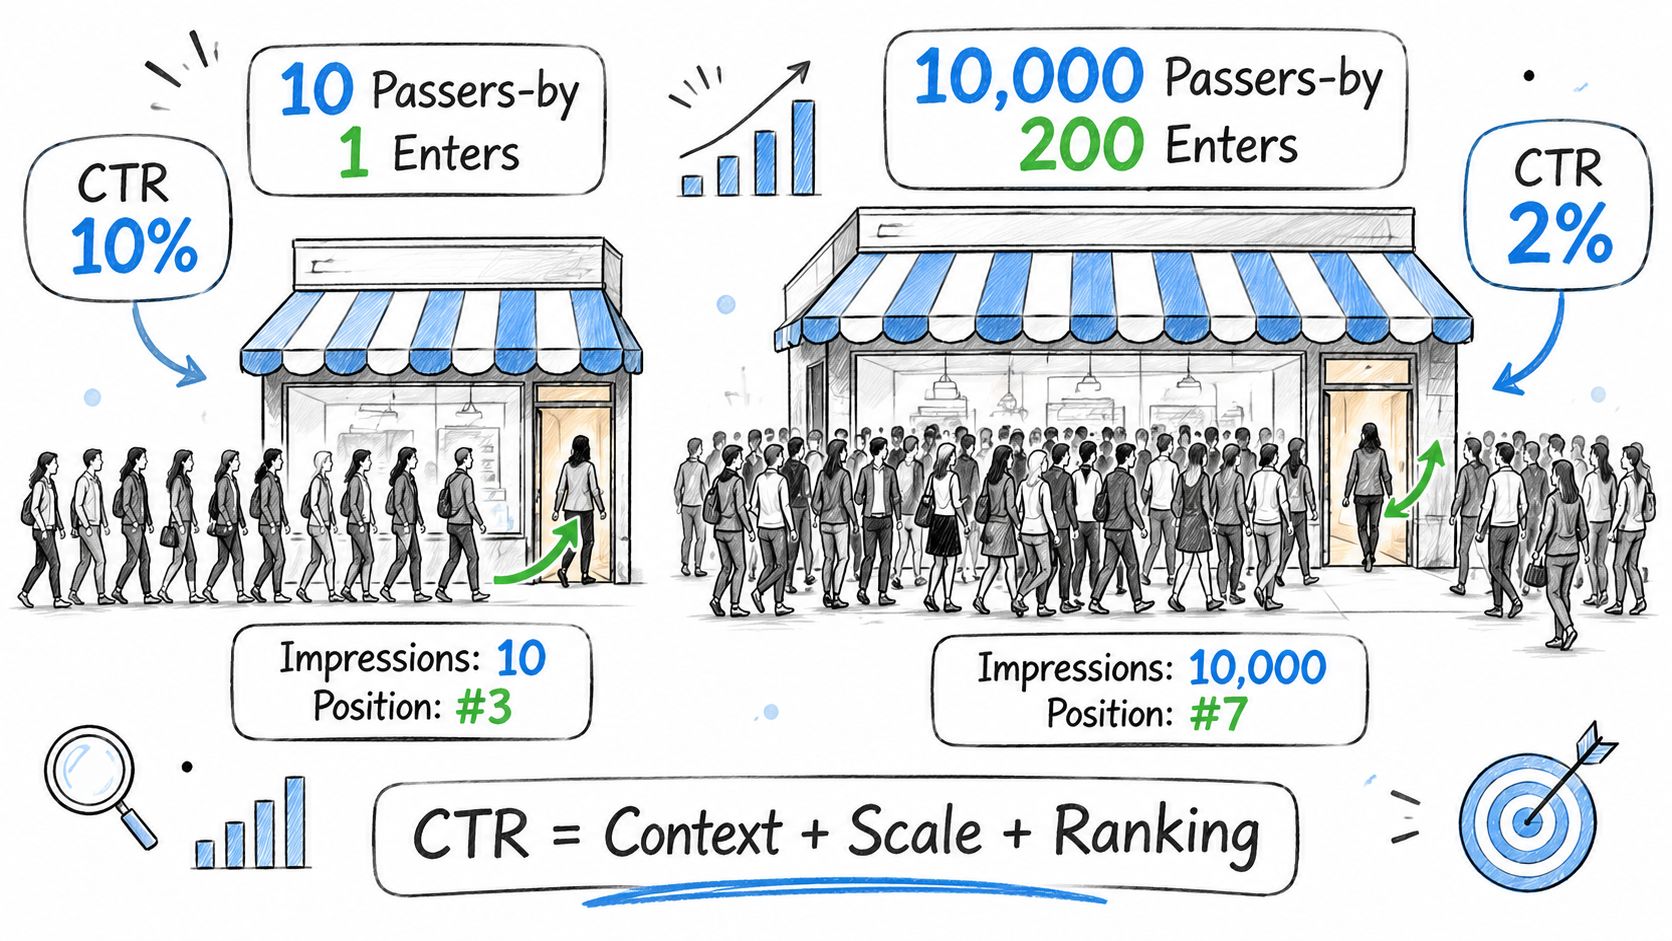
Impressions tell you how many chances the page had. Average position tells you where those chances came from. A page sitting at position 8 competes for a glance, not a decision, and its CTR will stay low no matter how well the title is written.
What each pairing usually means
| Situation | What it usually means | What to check next |
|---|---|---|
| High CTR, low impressions | Strong snippet with limited reach | Look for query variations and ranking gaps |
| Low CTR, high impressions, top position | Snippet does not match intent, or result features take clicks | Rewrite the title and check the results page |
| Low CTR, lower half of page one | Ranking too low to earn many clicks | Improve rankings before editing the snippet |
| Rising impressions, flat CTR | Page reaching weaker or broader queries | Segment the new queries before judging the page |
| Falling CTR, stable position | Seasonality, changed results layout or demand shift | Compare the same period a year earlier |
The second row is where most title rewrites get wasted. When a page ranks first and still earns a weak rate, the usual cause is a result that doesn't read like the answer, or a featured snippet, video block or shopping panel absorbing the clicks above it. Rewriting can fix the first. Nothing you write fixes the second.
The third row is the opposite mistake. Pages ranking fifth to tenth show low CTRs by default, because that's what those positions produce. Editing the title of a position-9 page is optimizing the wrong variable.
Give the numbers a year of context
Google rebuilt Search Console around a Search Performance report holding 16 months of history when the redesigned experience rolled out in 2018, a change announced on the Google Webmasters blog. The stated goal was year-over-year comparison, and it matters because CTR absorbs seasonality, ranking shifts, algorithm updates and brand campaigns. A four-week window turns an ordinary seasonal dip into what looks like a structural collapse.
If you want a walkthrough of how those panels are laid out before you start filtering, this covers the interface.
With that much history available, compare a month against the same month a year earlier before concluding anything changed. And when you want to connect those moves to sessions and conversions rather than clicks alone, the Google Analytics connection gives you the other half: the search-side ratio on one screen and the on-site outcome on the other.
Segmenting CTR by Query, Page, Device and Country
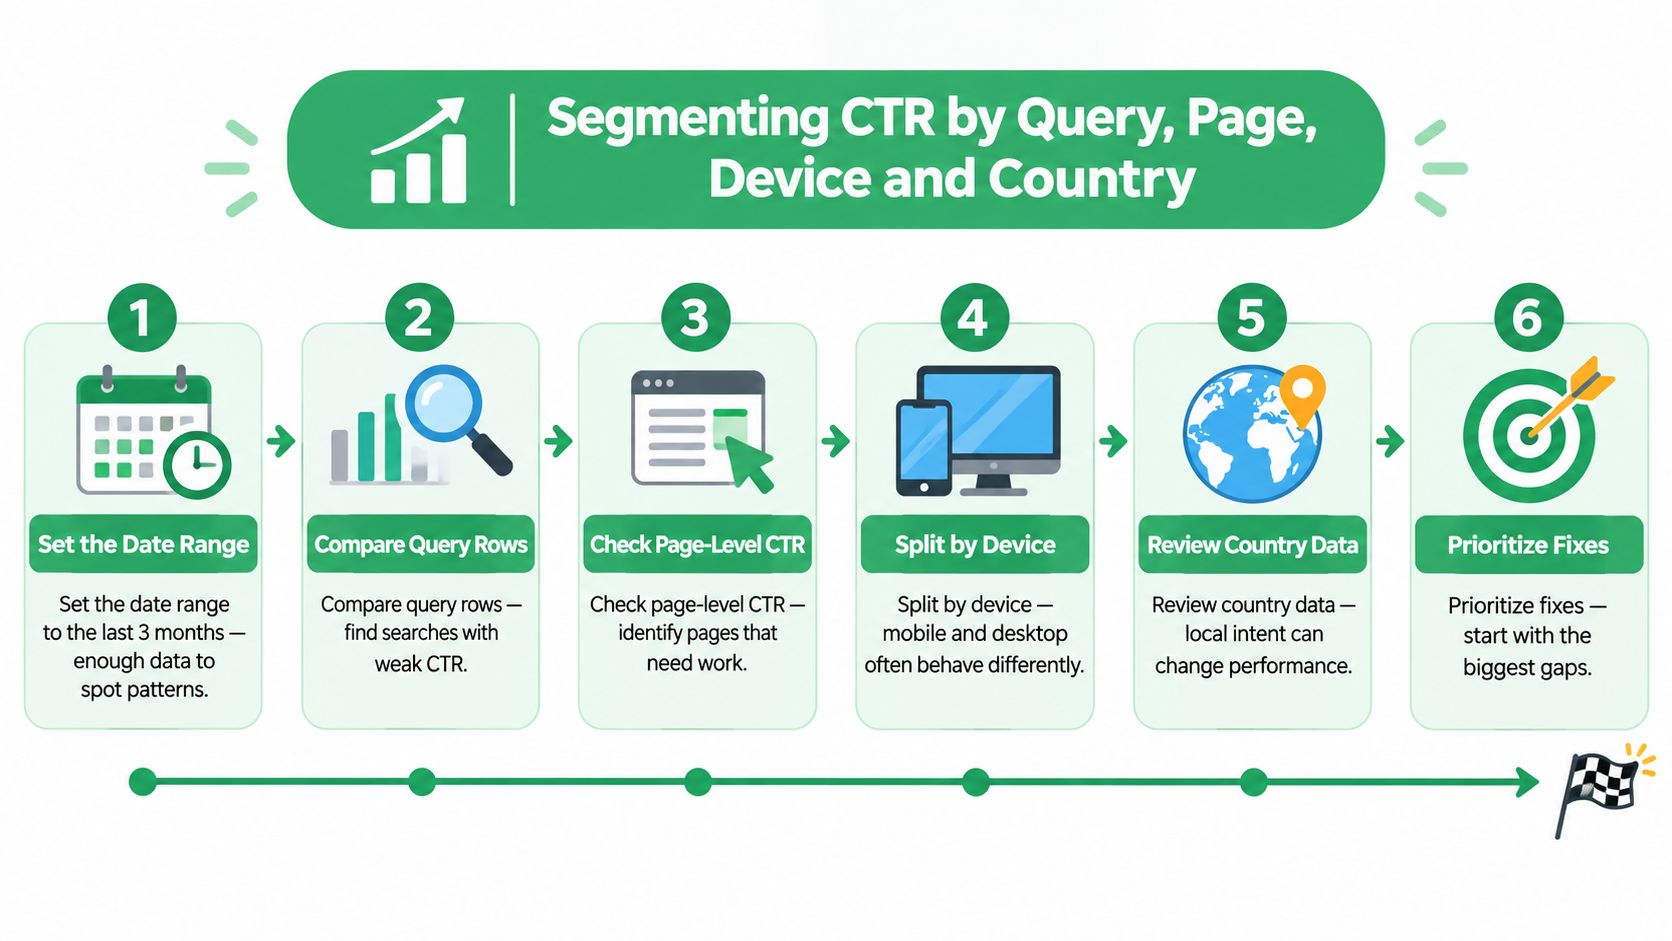
The property-wide CTR is an average across thousands of queries with almost nothing in common, so it can't tell you what to fix. Google's Performance report guidance makes the point directly: the metric is an observed aggregate rather than a universal benchmark, and it varies by query intent, device, country, result features, brand familiarity and position. Segment first. Judge later.
A seven-step pass through the report
- Set the range to the last three months, then compare against the same period a year earlier. Three months is enough volume to see patterns, and the comparison stops a seasonal dip from reading as a decline.
- Open the Pages tab and sort by impressions. Reach comes first, because a weak CTR on a page nobody sees costs you nothing.
- Sort by CTR from low to high. This surfaces the pages with real impressions and disappointing clicks, which are the only ones worth editing.
- Open a weak page and switch to the Queries tab. The gap usually concentrates in a handful of terms, and those terms tell you what the searcher wanted.
- Add the Device filter. Mobile and desktop results look different and attract different click behaviour, so a blended rate can hide a mobile-specific problem.
- Add the Country filter. A page that performs in one market and stalls in another often has a title that doesn't translate well, or a snippet promising something the local page never delivers.
- Check Search appearance. Rich results, video results and product panels above your listing cut into click share without your ranking moving at all.
What you should end up with is a short list of candidate pages, each carrying its top query, its device gap and its market. That list is the input to a title test. It's a very different artifact from a site-wide average.
Pulling the same cuts through the Search Console connector means asking for them in a sentence, grouped by query, page, country, device or date, instead of rebuilding the filter set by hand every Monday.
Checking How Much Query Data You Can See
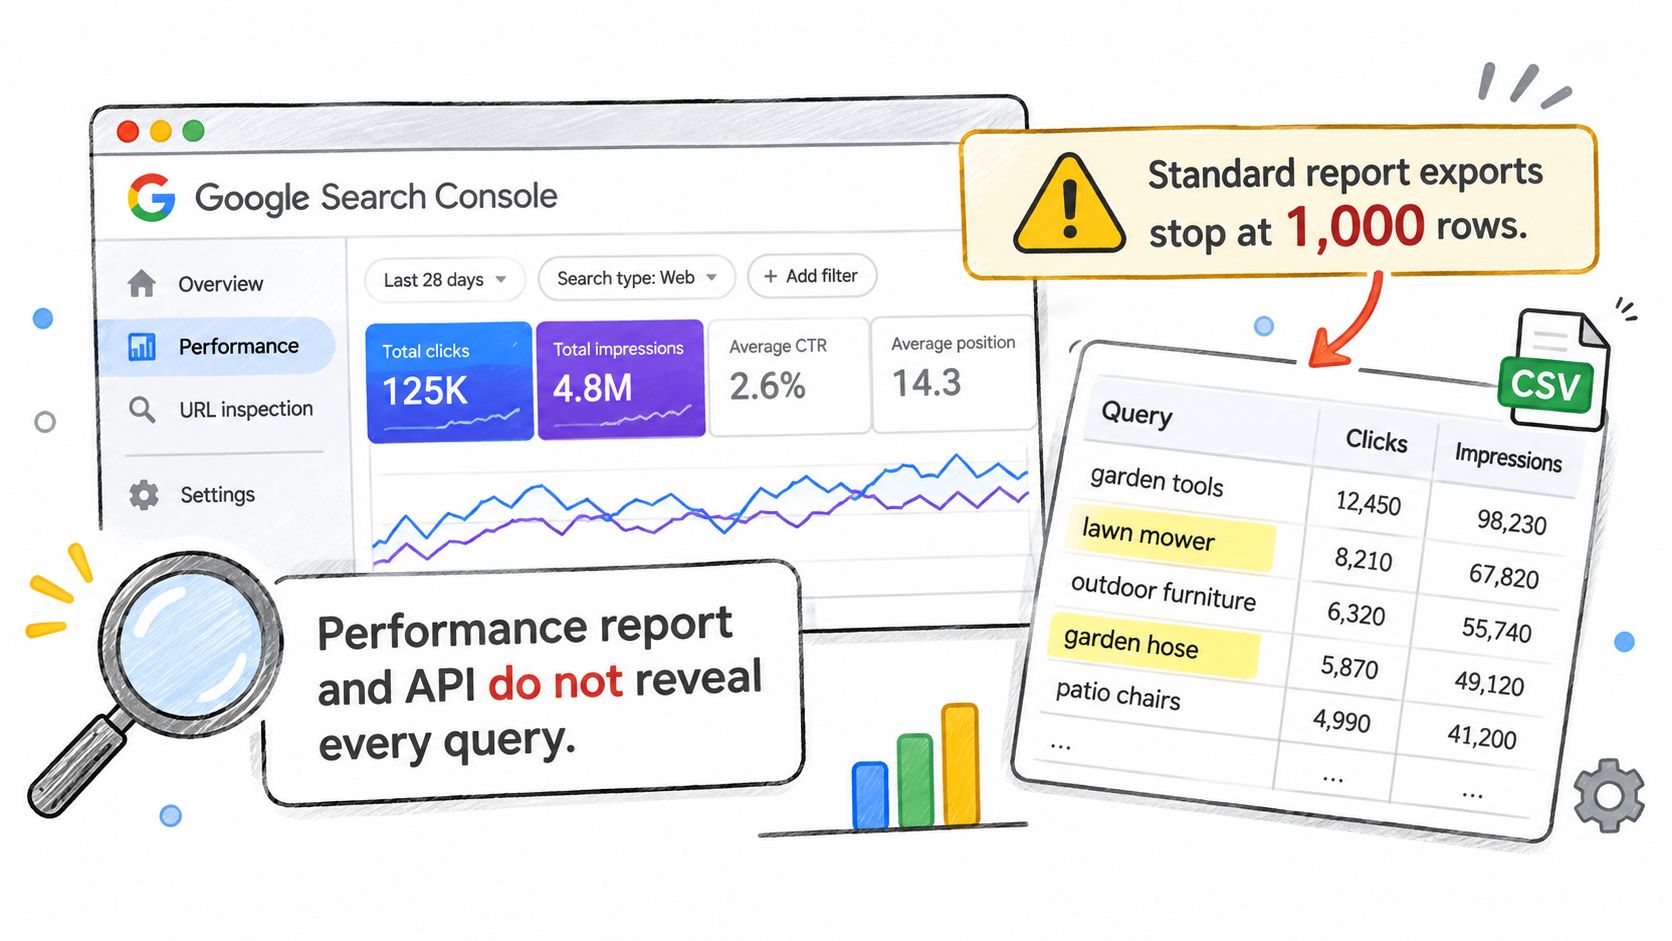
Here's the assumption worth questioning: that the Performance report shows you the searches people used to find you. It shows the most important rows, not the complete set. Google's documentation on the query data limit states that Search Console stores and displays only the most important query rows because of internal limitations. Standard report exports stop at 1,000 rows. The API caps out at 50,000 rows per day per search type and still doesn't guarantee every row. Bulk export to BigQuery removes the daily row limit and supports ongoing daily dumps, but anonymized queries stay excluded for privacy reasons.
The missing rows aren't random
The queries that drop out tend to be low-volume, long-tail and privacy-filtered. That's precisely the shape of search demand for a large catalog or an international site, where thousands of near-unique queries each add a few impressions. When those rows vanish, the CTR you calculate from what remains describes a biased subset. A page can look like it converts beautifully because the visible impressions are the branded, high-intent ones, while the long-tail impressions that dragged the rate down never entered the export.
The coverage ratio, and how to use it
Before drawing a conclusion about a page, measure how much of its impression base you can see.
- Divide visible impressions by total property impressions for the page and period. That's the coverage ratio.
- Segment it by query, page, device and country to find where the hidden share sits.
- Flag any page below roughly a third and label its CTR provisional until you have more visible data.
A worked case: a page records 1,000 impressions, and the visible query rows account for 300 of them. Its coverage ratio is 30%, so any CTR you quote describes 30% of its exposure. Report it that way. "CTR of 3.2% on 30% query coverage" is an honest statement. "CTR of 3.2%" invites someone to build a strategy on a number you can't defend six weeks later.
Practical rule: Report the coverage ratio next to the CTR whenever it sits below a third. Uncertainty stated up front is cheaper than a conclusion retracted later.
Bulk export makes long-run warehouse analysis practical, and for a catalog with thousands of URLs it's the right move. It doesn't create perfect query-level visibility, and no reporting change will, because the anonymization is deliberate.
Tips That Lift Organic CTR
Every fix below maps to a diagnosis you can make from the report. None of them is worth doing on a page ranking below the top few positions, because the position ceiling caps the gain before the title gets a chance to matter.
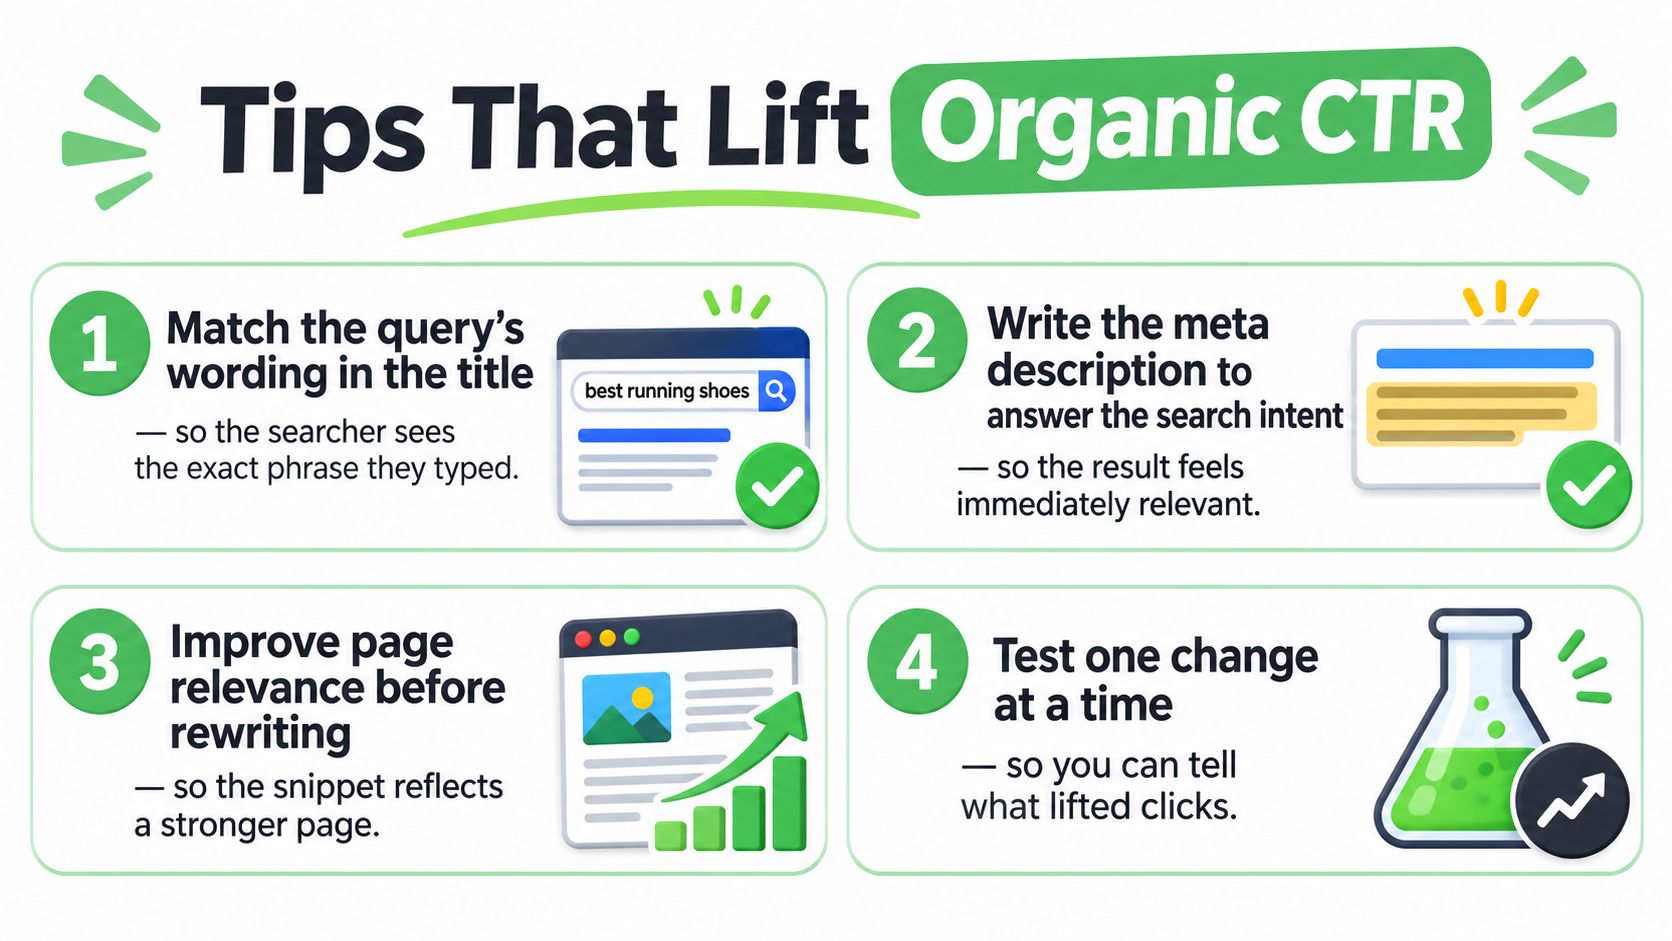
- Use the query's own wording in the title. A searcher scanning results for "commercial espresso grinder cleaning" recognizes those words faster than "How to maintain your equipment." The exact phrase does the work for you.
- Answer the query in the first sentence of the meta description. Repeat the title and you've spent your two lines saying nothing new. Descriptions get truncated in the results, so front-load the answer.
- Look at the results page before rewriting anything. Search the query yourself. If a featured snippet answers it outright, or a video carousel owns the top of the page, your listing is competing for leftovers. The fix there is content that answers more precisely than the incumbent, not a punchier title.
- Add structured data where the page type is eligible. Product, FAQ and Review markup can earn rich results, and rich results occupy more visual space, which earns more clicks. Mark up only what's truly on the page, because mismatched markup gets ignored.
- Make titles specific. A product name, a place, a year, a size. "Running shoes" blends into a list; "Trail running shoes for wet rock" doesn't. Specificity also filters out clicks from people who wanted something else, which is healthy.
- Keep the promise on the page. A snippet that oversells earns a click and a fast bounce, and that bounce teaches Google something about the page, not just the title. The win is temporary and the cost is real.
- Change one element per page and measure over a matched period. Two rewritten titles and a moved heading tell you nothing about which one moved the number.
CTR gains from title work are usually modest. They show up as a slightly different clicks total across a month rather than a dramatic jump on one day. Judge the change on total clicks over the full period, at the same position, with the same filters applied.
If you want the wider version of this work, including how titles, structured data and internal links fit together across a site, the SEO service overview lays out the sequence.
Turn CTR Findings Into a Title Test Plan
Pick one page. Not the worst CTR in the report, and not the biggest impression number. Pick the page that combines meaningful impressions, a rate clearly below its peers at the same position, and enough visible query data to trust the reading. A page whose queries are mostly hidden doesn't qualify, however bad the number looks.
Write two variants, change one element
Both variants should target the page's top query. Change one thing between them: a specific product name, a place, a year, or a clearer statement of what the page answers. Two variants that differ in three ways produce a result you can't attribute to anything.
Keep the filters fixed for the whole test. Same device, same country, same comparison period. Widen the country filter halfway through and you've introduced new demand into the sample, so the CTR moves for reasons that have nothing to do with your edit.
Set the baseline before you publish
Pull clicks, impressions, CTR and average position for that page on that query for the four weeks before the change. Then pull the same four weeks from a year earlier. The year-ago window distinguishes the actual effect of your edit from whatever the season was already doing.
Publish one variant, note the date, and leave the page alone. Four weeks is the minimum sensible checkpoint, because a week of data on a mid-volume query is mostly noise.
Judge clicks, not the percentage
At the four-week mark, compare clicks and CTR for the same page and query against both baselines. Keep the variant if clicks rose while average position stayed in a range where a click was realistic. Revert it if position held and clicks didn't move. And if position itself shifted, you learned something about ranking rather than about the title, which makes the test inconclusive rather than failed.
One page, one change, one year-ago baseline, four weeks. That's the whole protocol, and it will outperform a month of speculative rewrites.
NotFair connects an AI agent to Google Search Console and GA4 through a hosted MCP server, so you can ask which pages carry high impressions and weak CTR, check how much query data sits behind each one, and line the answer up against conversions in the same session. Reads happen live at query time, and any change you approve arrives with an explicit diff, a log entry and a one-call undo. Start on the NotFair free plan and run the coverage check on your ten highest-impression pages this week.