

If yesterday's Meta Ads report changes tomorrow, which version should you trust? The answer depends on more than whether the dashboard refreshed. You need to know what the metric counts, which attribution window produced it, and whether enough time has passed for conversions to arrive.
Conflicting numbers don't automatically mean broken tracking. Ads Manager, GA4 and your CRM can describe different parts of the same customer journey. Reliable Meta Ads reports make those differences visible, so you can distinguish a genuine performance problem from a measurement change before touching the budget.
Table of Contents
- Meta Ads Metrics and Formulas at a Glance
- What Reach and Frequency Reveal About Saturation
- How to Build a Meta Ads Report Step by Step
- Report Layouts for Each Business Question
- Attribution Windows and Why Conversion Totals Shift
- Why Recent Days Stay Provisional
- Separating Attributed, Matched and Incremental Conversions
- Fixing Realtime and Aggregated Data Mismatches
- Automating the Weekly Meta Ads Review
- Set Up Your First Meta Ads Report This Week
Meta Ads Metrics and Formulas at a Glance
Which metric should you trust? Trust the metric that answers your business question, then check the conditions behind it. Reach describes audience exposure, results describe the selected outcome, and cost per result connects that outcome to spend.
Core Meta Ads metrics, formulas and where to find them
| Metric | Formula or definition | Where to find it | Question it answers |
|---|---|---|---|
| Reach | Unique people who saw an ad at least once | Ads Manager reach column | How big is the audience being reached? |
| Impressions | Total times ads were shown, repeat views included | Ads Manager impressions column | How much delivery happened? |
| Frequency | Impressions divided by reach | Ads Manager frequency column | Are the same people seeing the ad repeatedly? |
| Spend | Amount paid to Meta in the period | Ads Manager amount spent column | Is budget pacing to plan? |
| Results | Times the chosen objective was achieved | Ads Manager results column | Is the campaign achieving its goal? |
| Cost per result | Spend divided by results | Ads Manager cost per result column | Which campaigns are efficient across different budgets? |
| CPM | Spend divided by impressions, multiplied by 1,000 | Ads Manager CPM column | Is the cost of delivery rising? |
| Link CTR | Link clicks divided by impressions, expressed as a percentage | Ads Manager link click-through rate column | Is the creative earning clicks? |
| Attribution setting | Window and interaction type used to count conversions | Ad set attribution setting | Are the periods counted the same way? |
CPM isn't a pure measure of auction competition, and link CTR isn't a measure of profitability. Audience mix, placement and delivery choices can affect CPM; an appealing ad can earn clicks without producing qualified customers.
Calculate ratios from totals
For a reporting period, calculate cost per result from total spend divided by total results, not the average of daily cost-per-result values. Otherwise, a low-spend day gets the same influence as a high-spend day.
Apply that principle to CPM and link CTR too. For frequency, use the period's deduplicated reach from Meta rather than adding daily reach, because the same person can appear on different days.
Comparison check: Confirm that every column uses the same date range, currency, attribution setting and objective before deciding which campaign performed better.
Also inspect the result label. Comparing cost per lead with cost per landing-page view doesn't establish which campaign is more efficient at acquiring customers.
What Reach and Frequency Reveal About Saturation
Say Campaign A and Campaign B deliver the same volume of impressions, but Campaign A reaches a smaller audience. Campaign A therefore has higher frequency: more of its delivery consists of repeated exposure rather than additional people.
That distinction follows Meta's ads reporting guidance, which separates reach, the people who saw an ad at least once, from impressions, the times ads appeared on screen. Its reporting framework also separates results for the selected objective from cost per result.
Higher frequency alone doesn't prove saturation. A reminder campaign may benefit from repeated exposure, while another audience may stop responding quickly.
Look for a combination of signals
Use the following checks before diagnosing fatigue:
- Exposure trend: Are impressions increasing while unique reach barely changes?
- Response trend: Is link CTR declining as frequency rises?
- Efficiency trend: Is cost per result increasing over comparable, mature periods?
- Delivery location: Is the deterioration concentrated in a placement, platform, device or audience segment?
Use daily, weekly, fortnightly or monthly views to inspect the trend. Then examine age, gender, placement, platform and device separately to locate where delivery occurred, rather than assuming the whole account has the same problem.
If those signals align, investigate Meta Ads creative fatigue before adding budget. Compare different hooks, offers and formats, not merely different background colors.
For a seasonal campaign, Nereo's Christmas video content for social campaigns can provide a resource for developing holiday-specific creative variations. Treat any replacement as a test, not a guaranteed remedy.
Repeated exposure becomes a concern when response and efficiency deteriorate alongside it. Address the creative or audience constraint before paying for more of the same delivery.
How to Build a Meta Ads Report Step by Step
Build the report around a decision, not an export. Before selecting columns, write down who will use it and what they're allowed to change.
Use this process as the starting structure.
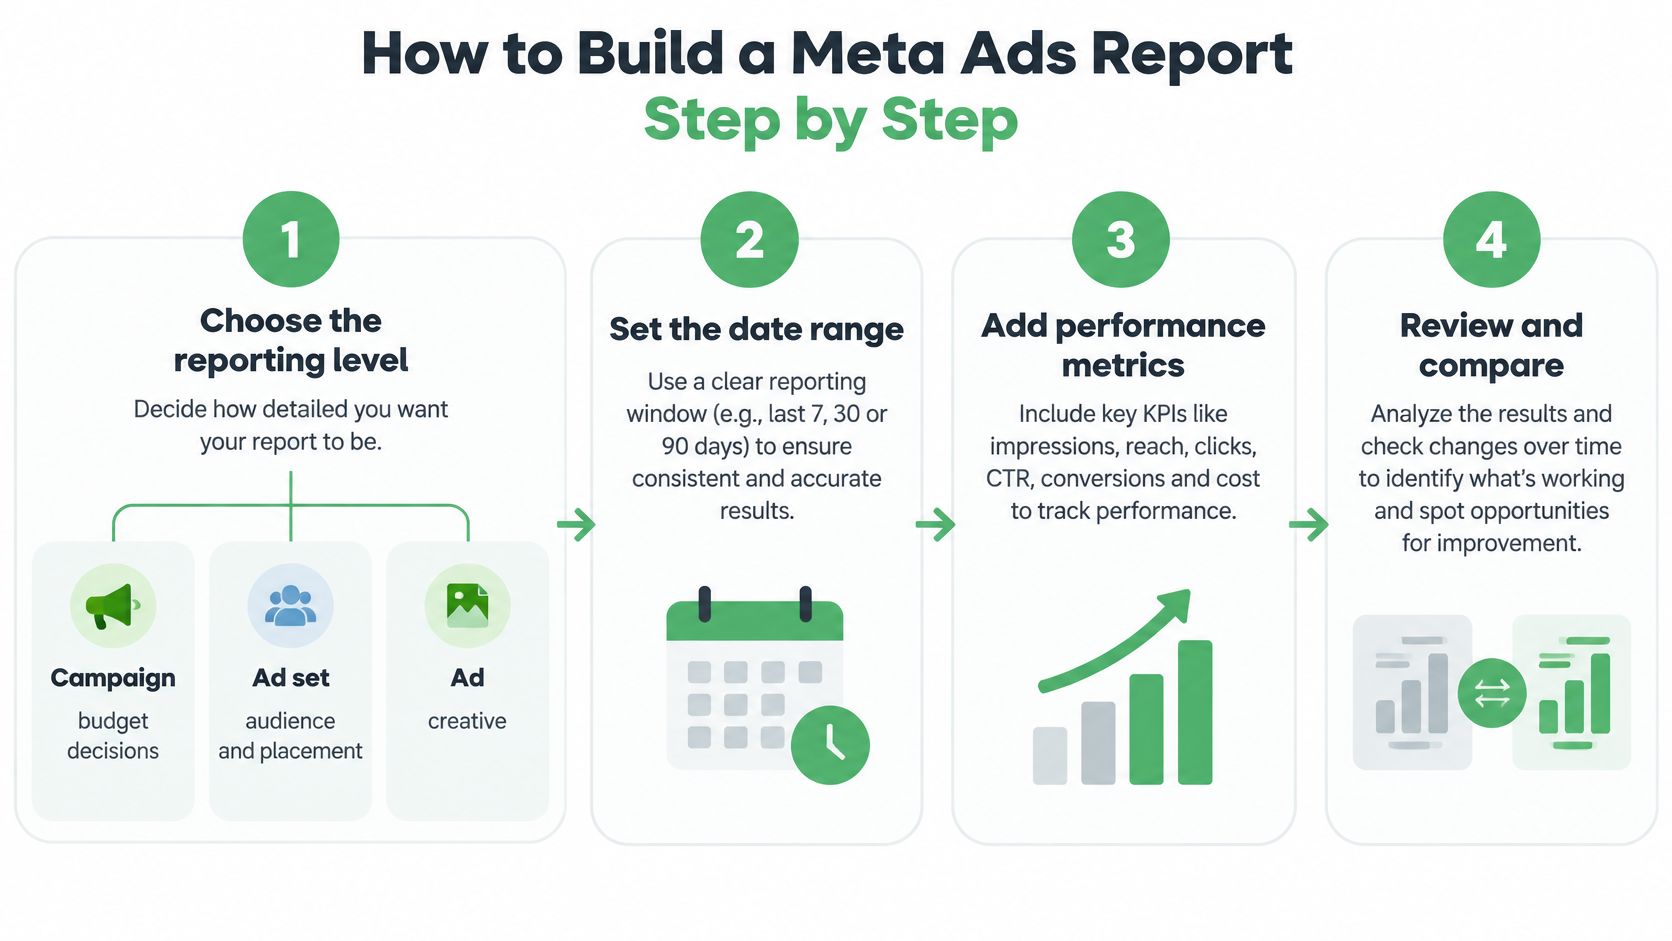
Configure the report
Choose the reporting level. Use campaign level for budget allocation, ad set level for audience and placement analysis, and ad level for creative decisions. Keep identifiers alongside names so renaming an ad doesn't break its history.
Set the date range and timezone. Confirm the ad account timezone before exporting, then record it in the report header. Daily totals from another timezone may assign activity to a different calendar date.
Select the objective-specific columns. Include results, the result type, cost per result, spend, reach, frequency and link CTR. Add purchase value or another outcome only when its definition supports the decision.
Reconcile totals before adding breakdowns. First match the unsegmented export to Ads Manager under identical settings. Then add the relevant breakdown and label each table, since some metric and breakdown combinations aren't available together.
Record the attribution configuration. Put the selected window and interaction type in the header rather than burying them in a dashboard filter. Preserve the configuration with each saved export so historical comparisons remain interpretable.
Add a downstream outcome. Bring in CRM-qualified leads, accepted opportunities or revenue, using a documented date basis. Don't join campaign totals solely by date when campaign identifiers or tagged source fields are available.
Save the layout and assign maturity labels. Preserve the columns, filters and reporting level as a reusable template. Add a status field for final, provisional or accumulating dates rather than presenting every row as equally settled.
Make the first report auditable
Keep a small metadata block with the account, extraction time, currency, timezone, attribution setting and applied filters. Record the source of each downstream field, including whether revenue reflects orders placed, payments received or another business definition.
A healthy first report doesn't need elaborate charts. Its totals reconcile with Ads Manager, every table names its measurement conditions, and each table answers a distinct question.
If reconciliation fails, resolve that discrepancy before adding design work. A polished dashboard won't make mismatched definitions comparable.
Report Layouts for Each Business Question
Is spend pacing to plan? Start with campaign spend by day beside the planned budget and results. That tells the budget owner whether delivery is on track without requiring them to inspect every ad.
For other decisions, change the reporting level and breakdown deliberately. Open only the columns that answer the question, rather than preserving every available metric.
Report layouts by business question
| Business question | Report level | Breakdown | Columns to show |
|---|---|---|---|
| Is spend pacing to plan? | Campaign | Day | Spend, budget, results |
| Which ad set gets the cheapest results? | Ad set | None | Spend, results, cost per result |
| Is creative fatiguing? | Ad | Week | Frequency, link CTR, CPM |
| Which placement delivers? | Ad set | Placement and platform | Impressions, results, cost per result |
| Which device or age group converts? | Ad set | Age, gender, device, in supported separate views | Results, cost per result |
| Do platform leads qualify? | Campaign | Week | Results, CRM-qualified count, qualified rate |
The cheapest-results layout needs a consistent result definition. An ad set generating inexpensive form submissions isn't necessarily outperforming an ad set generating fewer submissions that become sales opportunities.
The lead-quality row therefore requires a second data source. Calculate qualified rate against a clearly defined lead cohort, and allow enough time for the sales team to assess those leads. Don't divide this week's qualified leads by this week's submissions if qualification relates to earlier submissions.
Keep a stable weekly layout for recurring decisions. Build an ad-hoc view only when you can name the question it will answer.
When investigating wasted Meta Ads spend, connect delivery costs with downstream value rather than labeling every expensive placement wasteful. A higher acquisition cost may still be acceptable when the resulting customers are worth more.
Choose the questions that matter most this month and build those tables first. Consistent columns make meaningful changes easier to notice.
Attribution Windows and Why Conversion Totals Shift
Comparing conversion totals without checking attribution settings can turn a configuration change into an apparent performance decline. The window is part of the metric's definition, not an optional footnote.
Meta's Marketing API Insights documentation describes settings including 1-day click, 7-day click, 1-day view and 1-day engaged-view, with comparison reporting for options such as 1-day view, 1-day click and 7-day click. Engaged-view can include qualifying video engagement or a non-link interaction.
Click-through attribution counts qualifying conversions after a click. View-through attribution can count conversions after exposure without a click, so different settings can produce different totals for the same delivery.
For shared reporting terminology, PlatformDTC's attribution window terminology explained is a useful reference when aligning marketing and finance teams.
Preserve the counting rules
Say an ad set moves from a longer click window to a shorter one. Reported conversions can fall even if the ads, spend and customer behavior haven't changed, because later conversions no longer qualify under that setting.
- Store the configuration: Keep attribution settings beside each conversion metric.
- Separate interaction types: Preserve click-through, view-through, engaged-view and direct on-ad actions where available.
- Reconcile before judging: Align counting rules, timezone, deduplication and reporting latency before calling a Meta-to-GA4 or CRM difference an error.
Pair platform conversions with a downstream outcome such as qualified leads or revenue. That helps prevent attribution changes from being mistaken for business changes.
Why Recent Days Stay Provisional
Say yesterday's acquisition cost looks worse than the cost for an older, mature cohort. Pausing the campaign immediately could be a mistake: yesterday's spend may already be recorded while some associated conversions haven't arrived.
The diagram illustrates why recent dates need a separate status.
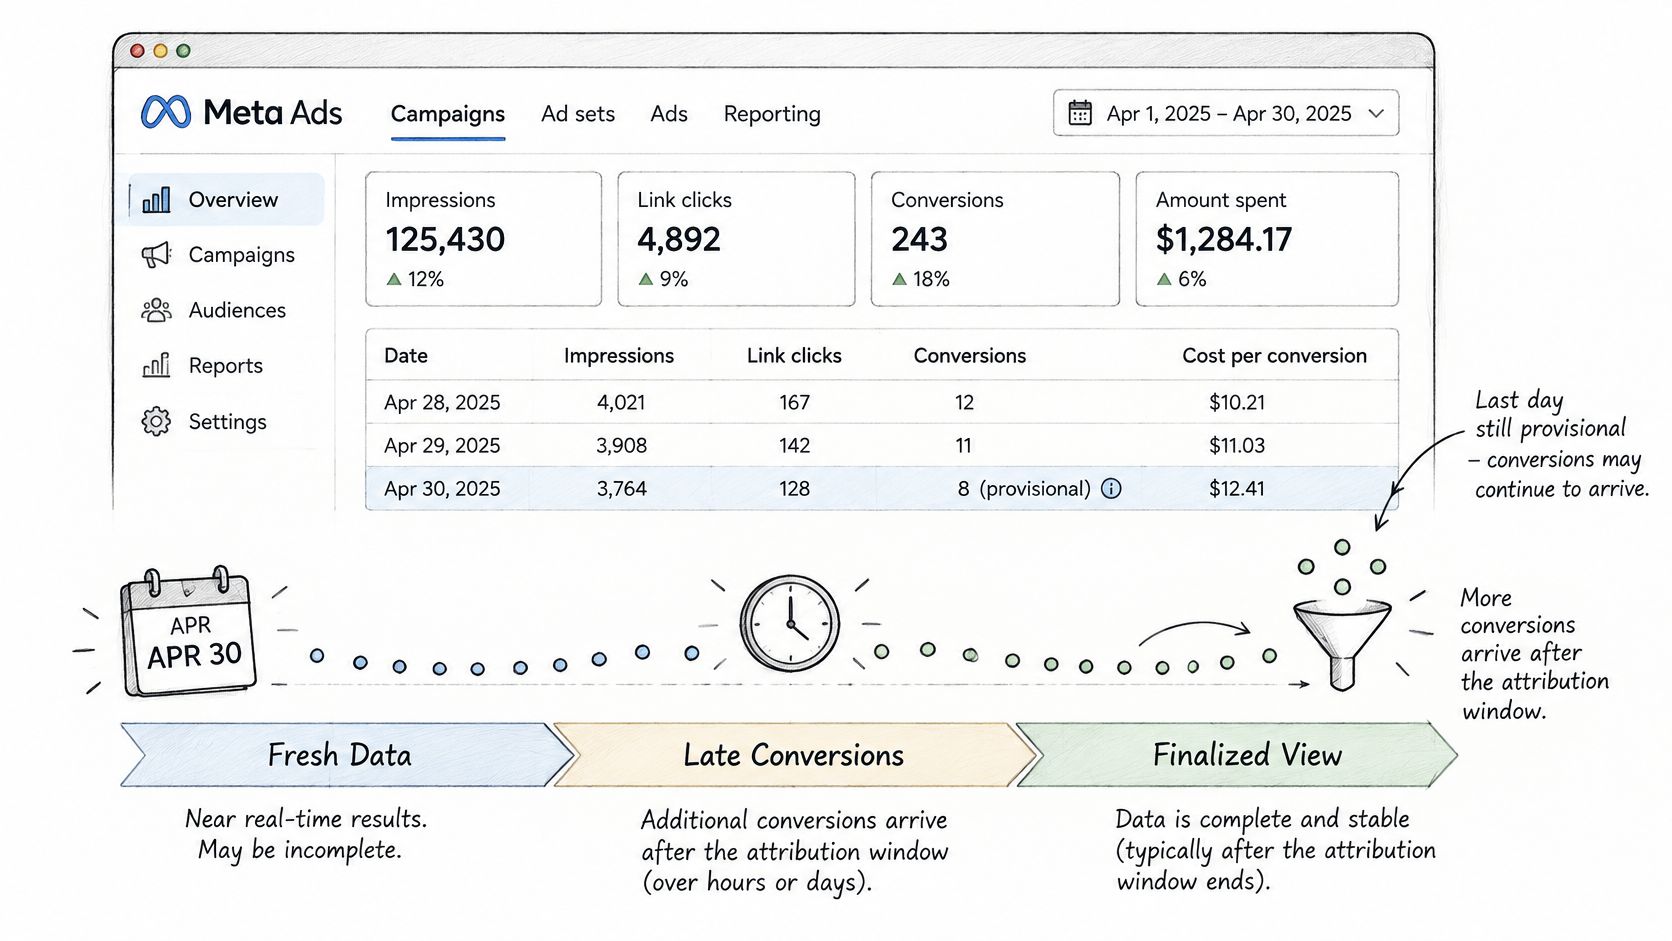
The Microsoft Learn Meta Ads connector FAQ documents delayed conversion reporting, including configurations using 7-day click and 1-day view windows. Ending the selected date range doesn't mean every attributable outcome has been received.
Add a data maturity layer
Use operational labels with explicit rules:
- Accumulating: The newest cohorts are still receiving a material share of expected conversions.
- Provisional: The attribution window or normal processing period remains open.
- Final for routine review: The window has closed and the usual ingestion delay has passed, while allowing for later corrections.
Estimate received conversions divided by expected eventual conversions using historical lag for comparable campaign cohorts. Treat that share as an estimate, not a platform-certified completeness score.
Separate lead generation, subscription and ecommerce cohorts when their decision or processing delays differ. A signup completed immediately and a purchase completed after consideration shouldn't inherit the same maturity rule.
Use the video alongside the date-status fields when reviewing the reporting workflow.
Conversion-time views answer when customers acted. Impression-time or click-time views help assess the delivery cohort associated with those actions; use the available reporting basis and label it explicitly.
Budget safeguard: Don't pause or cut budget solely because accumulating dates show a weak acquisition cost. Compare cohorts at equivalent maturity.
Separating Attributed, Matched and Incremental Conversions
A useful report answers different questions: Did the business record an outcome? Could Meta associate it with an ad interaction? Did advertising cause an additional outcome? Those answers belong in separate fields.
Attributed, matched and incremental conversions by question
| Question | Source | Where it appears in the report |
|---|---|---|
| Did the business record the outcome? | CRM or offline records | CRM-recorded column by date |
| Did Meta match it to an ad interaction? | Meta matching through Conversions API | Meta-matched column, where available, with the attribution window in the header |
| Did the ad cause it? | Holdout or lift test | Lift-test result shown beside attributed ROAS |
| Are conversions modeled or unmatched? | Meta modeled and unmatched counts, where exposed | Separate columns, never silently merged into matched conversions |
Meta's Conversions API documentation describes event delivery from server, CRM, offline and other sources for measurement and optimization, and states that it isn't a way to bypass iOS App Tracking Transparency or European privacy rules. Better transmission can improve measurement coverage, but it doesn't establish causation.
Keep measurement coverage separate from lift
Don't assume Ads Manager exposes a complete matched-versus-unmatched ledger. If a connector or report doesn't provide a field, mark it unavailable rather than estimating it by subtracting unrelated totals.
Similarly, a matched event isn't automatically an attributed conversion. It must also satisfy the applicable attribution rules, and attributed ROAS still doesn't reveal what would have happened without the ad.
Randomized brand-lift and conversion-lift studies sit above observational attribution in an incrementality framework because they compare exposed and control groups. When spend, outcome volume and test eligibility support a holdout, define the success metric and analysis plan before launching it.
Show the resulting lift estimate beside attributed ROAS, including the test scope and uncertainty. Don't apply a narrow test result to every market or campaign without justification.
Improved tracking can strengthen reported last-touch ROAS without changing incremental impact. Report measurement coverage and causal evidence separately so a tracking improvement isn't presented as new customer demand.
Fixing Realtime and Aggregated Data Mismatches
Yesterday's rising conversion total needs a maturity check, not an immediate tracking rebuild. Once you've accounted for delayed reporting, investigate persistent cross-tool gaps by matching definitions before comparing totals.
Reporting mismatches, causes and fixes
| Symptom | Likely cause | Fix |
|---|---|---|
| Meta conversions higher than GA4 | Different attribution windows; view-through counted by Meta | Align windows where possible and compare equivalent interaction settings |
| GA4 higher than Meta | Outcomes or sessions without Meta matching; consent limits | Inspect UTM-tagged sessions, compare equivalent conversion events and check consent implementation |
| CRM leads lower than Meta results | Unqualified or duplicate leads; delayed CRM sync | Compare deduplicated and CRM-qualified leads for the same cohorts and dates |
| Daily totals shift between tools | Account timezone differs from reporting timezone | Configure a common timezone where supported, or normalize exported timestamps |
| Spend differs between exports | Currency conversion or sync lag | Compare account currency, filters and extraction time |
A settings discrepancy may take a single inspection to identify. Matching behavior across Meta, GA4 and CRM records requires a sustained sample of mature, consistently tagged activity.
Compare like with like
UTM-tagged sessions help identify traffic paths, but sessions aren't conversions. Compare the same business event before concluding that GA4 records more outcomes than Meta.
For lead discrepancies, inspect duplicate event IDs, browser-and-server deduplication, form completion definitions and CRM synchronization. Keep raw submissions separate from qualified leads.
If differences persist after attribution, timezone, currency and extraction conditions align, inspect tracking and consent implementation before changing budgets. Some residual disagreement may reflect legitimately different measurement methods rather than a repairable error.
Automating the Weekly Meta Ads Review
Automation should reproduce a defined analysis, not generate a fresh dashboard design every week. Keep the layout fixed, schedule the extraction, and specify how comparisons and exceptions are handled.
Run a repeatable sequence
Extract mature cohorts on Monday. Use a scheduled platform export or an agent runtime that supports the required reporting calls. Select the latest mature reporting period rather than blindly taking the latest calendar dates.
Populate the saved layout. Write the campaign, creative, placement and lead-quality views into the template. Retain extraction metadata and leave missing fields visibly missing.
Compare equivalent periods. Apply the same attribution configuration and maturity requirements. Flag cost-per-result changes beyond a team-defined threshold for human review, not automatic pauses.
AY Automate's AI marketing automation service is a relevant resource when scoping scheduled workflows and review handoffs. Define the data contract and approval responsibilities before choosing the implementation.
At NotFair, we connect Google Ads, Meta and Search Console using the client's own logins, so the data and history stay with the client.
Before each run, check:
- Authorization: Confirm logins and permissions remain valid.
- Configuration: Detect attribution-setting changes.
- Coverage: Confirm the export contains every expected date.
Deliver a concise summary containing the tables, exception flags and questions requiring a decision. Route proposed Meta Ads budget shifts to a reviewer with the supporting evidence attached, rather than treating an alert as permission to act.
Set Up Your First Meta Ads Report This Week
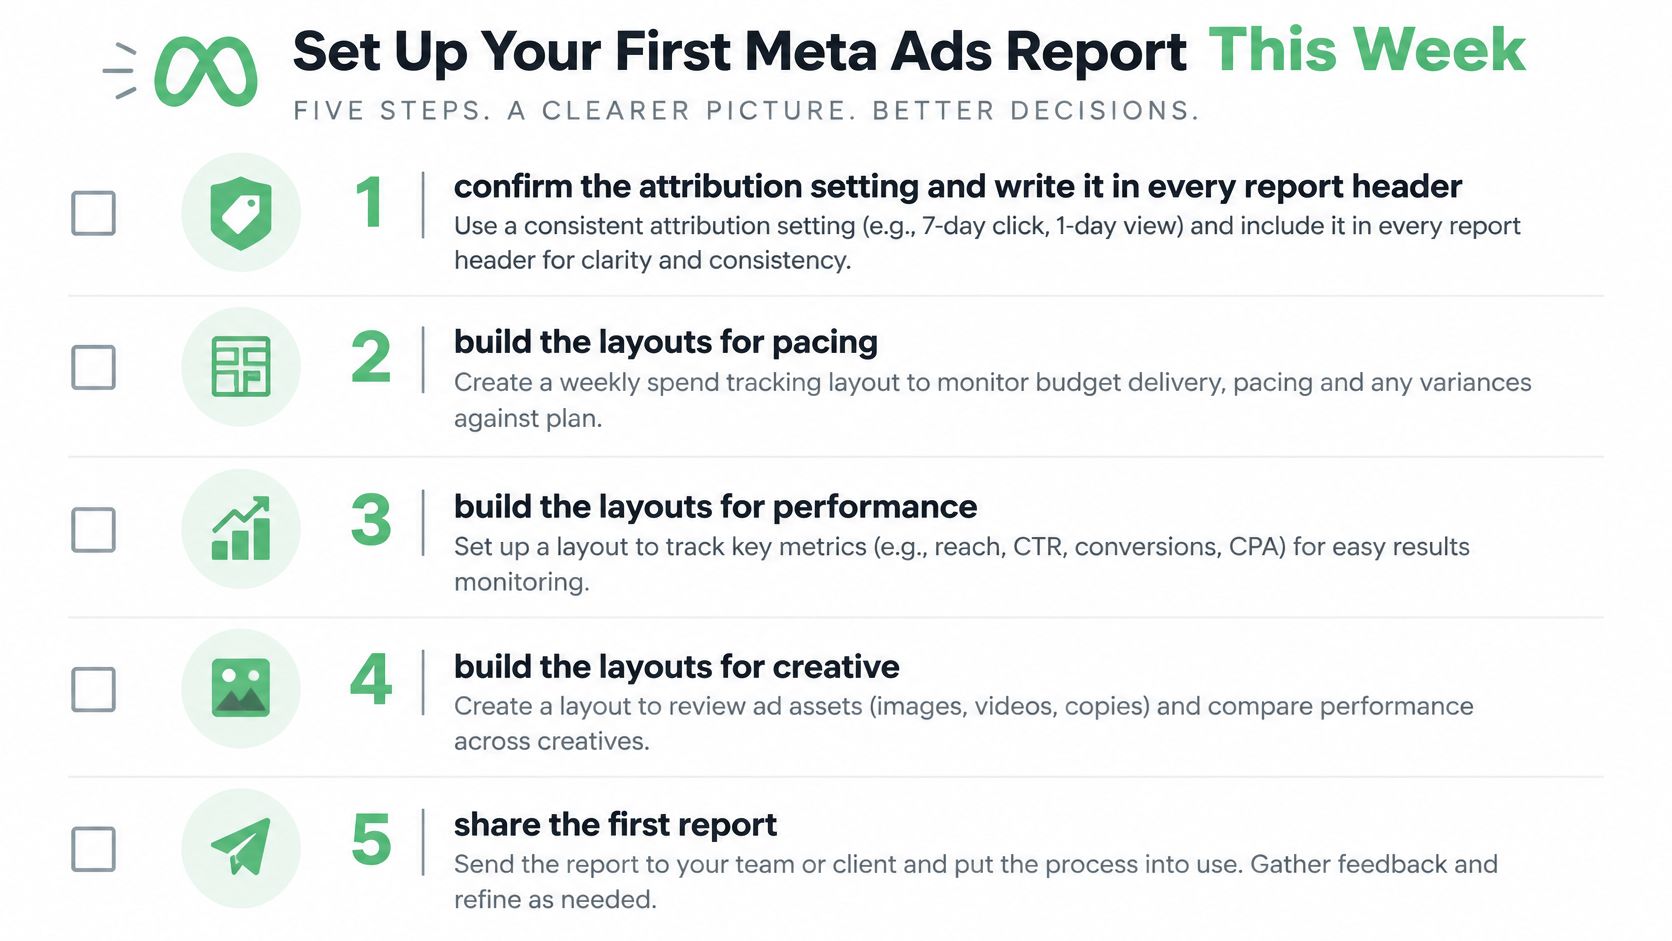
Make the setup decisions before running the first review:
- Confirm the attribution setting and write it in every report header.
- Build the decision layouts for pacing, creative, placement and lead quality.
- Label recent dates as provisional or accumulating using your cohort-maturity rules.
- Schedule the weekly review and define the cost-per-result flag that requires human investigation.
Use this checklist to assign ownership and finish the setup.
Our Free plan includes 2 shared ad-account spots across Google, Meta, X, LinkedIn, Reddit and TikTok, while Search Console and Analytics are unlimited.
Run the first report on a mature weekly cohort, reconcile its totals with Ads Manager, and confirm that every table names its window and timezone. Assign each unresolved discrepancy to an owner before approving changes.
No budget change should follow from accumulating dates or a flag alone. Require an explanation that connects the metric movement to a business outcome and a reviewable action.
NotFair gives your AI agent live, governed access to advertising and analytics accounts, with approval-gated campaign changes and logged history. Visit NotFair to connect your accounts and build a Meta Ads review that separates reporting differences from decisions that need action.