

Facebook ads work for some objectives, and published lift studies show gains beyond the click, such as the 2018 meta-analysis finding 19% more organic-search visits and 10% more paid-search visits from exposed audiences. That evidence doesn't settle whether your campaign is profitable, because the result depends on the objective, the audience, and what happens after people reach your site.
That distinction is where most budget decisions go wrong. A campaign can create demand that shows up later as a search, a direct visit, or an offline purchase, so last-click reports can undervalue it. A campaign can also claim credit for buyers who would've converted anyway, so platform reports can overvalue it. If you're asking does advertising on Facebook work, you're really asking a narrower question. What did this spend cause that wouldn't have happened without it, and was that extra result worth more than it cost?
Table of Contents
- When Facebook Ads Work and What the Studies Show
- Attributed Results vs Incremental Lift
- Where Facebook Ads Pay Off by Objective and Industry
- When Attribution Misleads Your Budget
- How to Run a Lift Test Before You Scale Spend
- Warning Signs That Facebook Ads Are Not Working
- Confirm the Scale Decision Before Moving Budget
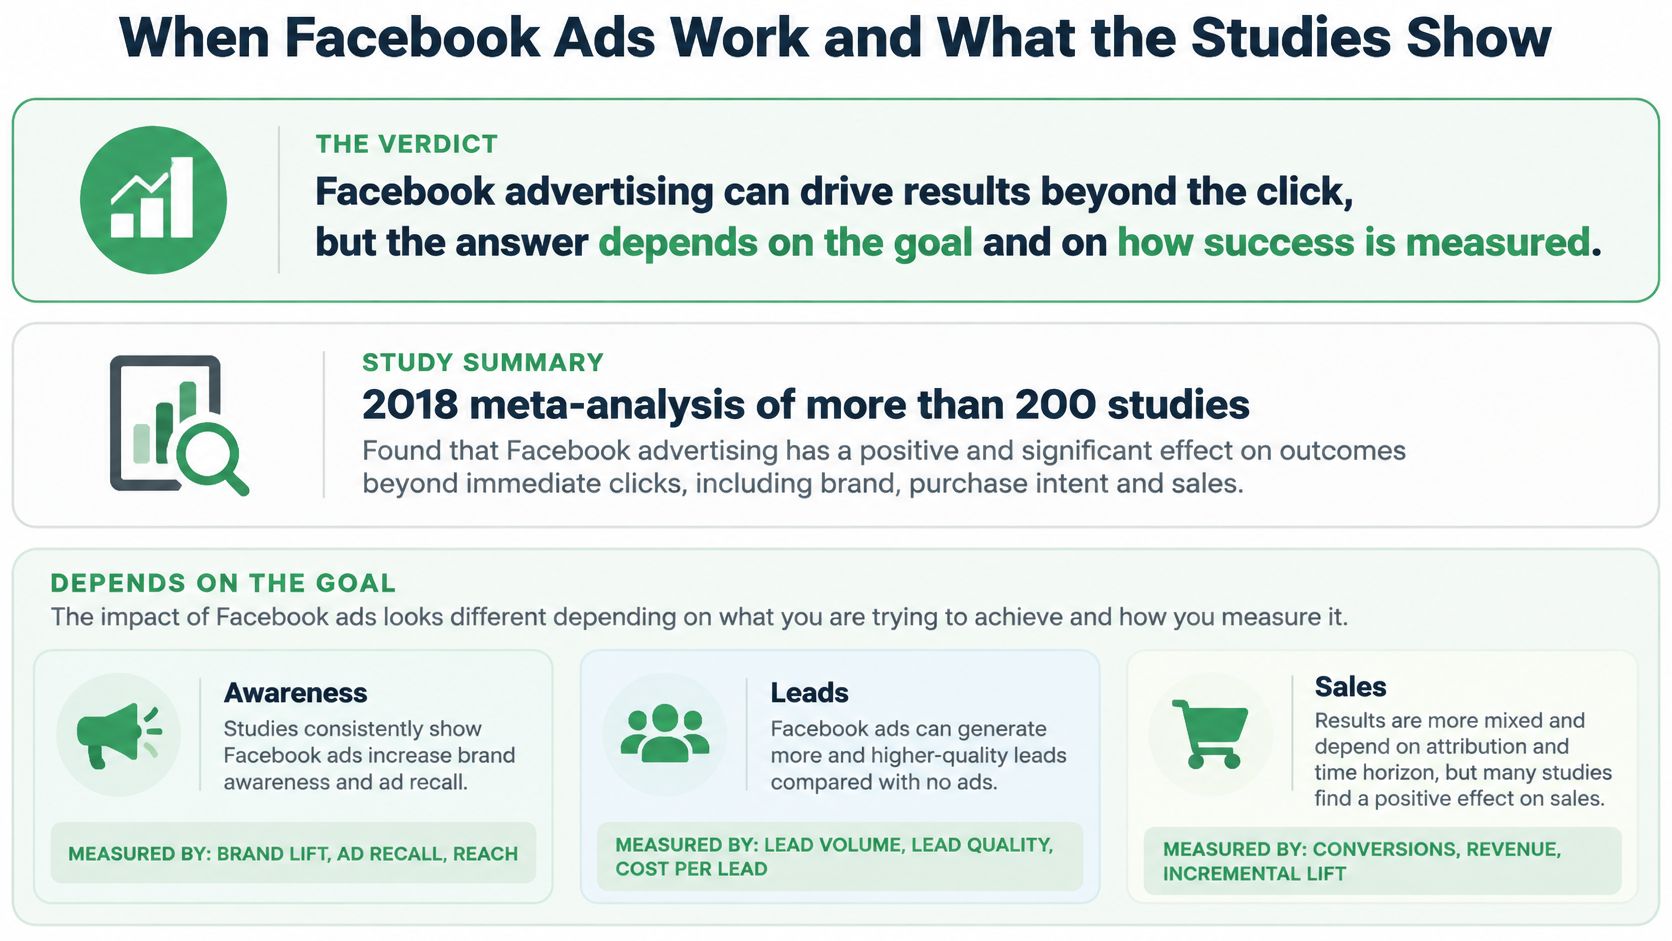
When Facebook Ads Work and What the Studies Show
In a 2018 meta-analysis of more than 200 brand and conversion-lift studies across North America, exposed audiences generated 19% more organic-search-referred visits and 10% more paid-search-referred visits than unexposed audiences. About one in two incremental search-referred visits led to an on-site action, such as a purchase, an item added to a basket, or a content view, according to Meta's analysis of how Facebook ads drive online search.
Published Evidence on Facebook Ad Effectiveness
| Study | Setup | Reported result | Caveat |
|---|---|---|---|
| 2018 meta-analysis, North America | Exposed vs unexposed audiences across 200+ brand and conversion-lift studies | +19% organic-search visits, +10% paid-search visits, about 1 in 2 incremental search visits led to an on-site action | Average effects, not a guaranteed return for every advertiser |
| Open Colleges (Meta Conversion Lift) | Randomized test and control groups | Website inquiry conversions and offline enrollments increased; acquisition cost was lower than under the last-click model | One advertiser, Meta-reported |
| Gruvi, Nov 2024 to Jan 2025 | Conversion Lift study | 48,117 incremental search visits, 3.3x incremental ROAS, +16% incremental conversions | Platform-published; may reflect unusually strong execution or budget |
Meta's Gruvi Conversion Lift case reports results from November 2024 to January 2025. They show what one advertiser achieved under its own audience, creative, budget, and category conditions, not what another campaign should expect.
The broader pattern is that ad exposure can affect search behavior and later actions, not just clicks. The meta-analysis estimates average effects across many studies; an individual case shows a result in one specific setting. Neither establishes that a campaign is profitable for every advertiser. That requires comparing outcomes with what would have happened without the ads and checking the value of the additional results.
Attributed Results vs Incremental Lift
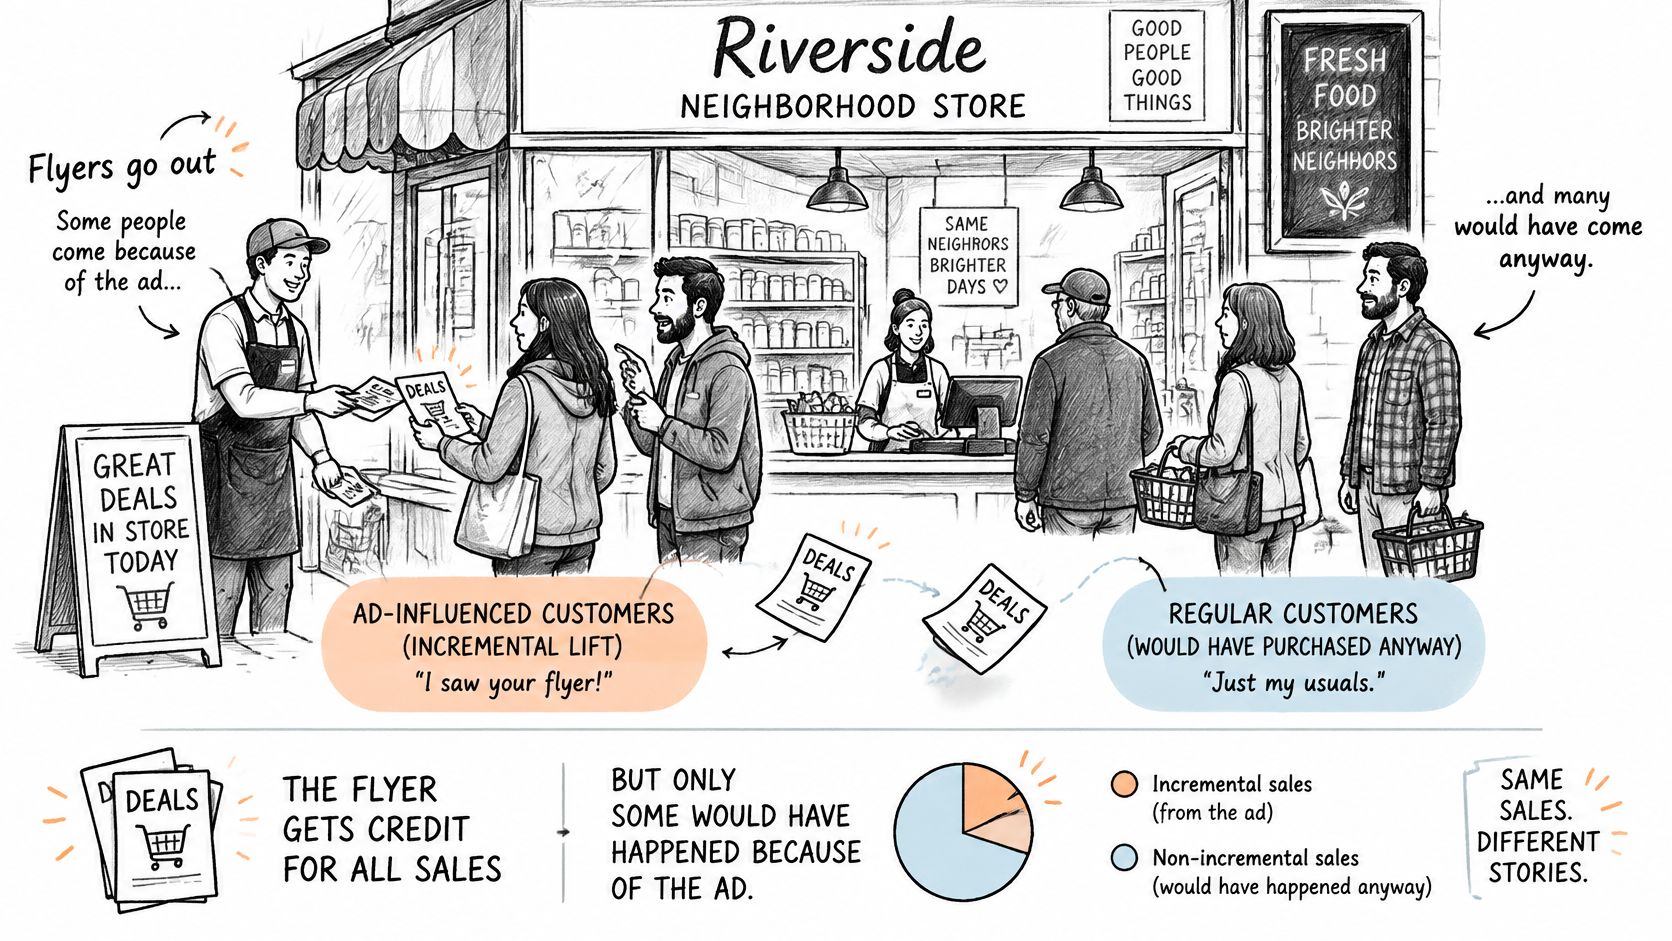
Say a shop hands out flyers outside the door. Some customers mention the flyer at the till, but some would've walked in anyway because they shop there every week. If the shop credits the flyer for everyone who mentions it, the flyer looks more powerful than it is.
The diagram below separates influenced customers from customers who needed no prompt.
The Three Numbers You Need
- Attributed conversions: What the platform credits after a click or view within its attribution window. This is a reporting count, not a causal count.
- Incremental conversions: The extra conversions the ads caused, estimated by comparing people eligible to see ads with a comparable group withheld from them.
- Downstream qualified revenue: The qualified pipeline, sales, and margin that follow, confirmed outside Ads Manager in analytics and your CRM.
Meta explains this test design in its Conversion Lift methodology, which uses randomized assignment, a test group eligible to see ads, and a control group withheld from them. Incremental conversions are estimated from the difference between the two groups after scaling the control population. That design separates conversions caused by advertising from conversions that would've occurred anyway, which is the central weakness of click-through and last-touch attribution.
If you're still choosing between touch-based attribution models, that comparison is useful for reporting, but neither model answers the causal question. First touch and last touch redistribute credit among touches. A holdout asks whether the ads changed the total.
The video below is worth watching before you rework your reporting, because the worked logic is easier to follow visually than in a dashboard.
Take a hypothetical campaign that reports 100 attributed leads. The holdout shows only 60 incremental leads, because 40 similar leads appear in the control group without ads. Your dashboard cost per lead understates your true incremental cost per lead, and scaling on the dashboard number means scaling on an overcount.
Use the Google Analytics connector documentation to join the other side of the picture, sessions, conversions, and downstream behavior, with what Meta reports. Then answer three checklist questions.
- Which number drives your budget: Attributed, incremental, or qualified revenue?
- Have you ever held out a control group: If not, you haven't measured lift yet.
- Does the CRM agree: Do the extra leads become opportunities at the normal rate?
Where Facebook Ads Pay Off by Objective and Industry
The same campaign can succeed or fail depending on its objective and the business model behind it. A B2B SaaS firm, a law firm, and a dental practice shouldn't judge a lead form the way an ecommerce store judges a purchase. Each business buys a different downstream event.
For lead generation, the endpoint is a qualified opportunity, not a form fill. Cheap leads that sales can't reach, or that sit outside your service area, aren't cheap. They're a reporting illusion that consumes follow-up time.
For ecommerce, the endpoint is contribution margin after discounts, shipping, and returns. A discount-led campaign can show strong attributed ROAS while training buyers to wait for offers and pulling forward sales you'd have made at full price.
Local services have a tighter test. The endpoint is a booked job, so call quality, service area, and capacity matter as much as click price. Prospecting and awareness sit at the other end. Their endpoint is often incremental search and branded-search activity, which means last-click sales will look weak even when the campaign is creating demand.
Success Metric and Common Failure by Objective
| Objective | Judge it by | Common failure |
|---|---|---|
| Lead generation | Cost per qualified lead and opportunity rate | Form fills that never become pipeline |
| Ecommerce sales | Contribution margin after discounts, shipping and returns | Discounts that inflate attributed ROAS |
| Local services | Booked jobs and cost per booked call | Loose-match queries producing unqualified calls |
| Prospecting and awareness | Incremental search visits and branded-search lift | Credit taken by last-click reports |
| Retargeting | Incremental conversions against a holdout | Paying for users who would have converted anyway |
Retargeting deserves the strictest standard. Those audiences already know you, so they're the most likely to convert without another ad. Judge retargeting against a holdout, not against its own attributed ROAS.
There are no published industry benchmark figures in this evidence set that would let you outsource the judgment to an average. Set your own pre-launch cost per lead as the baseline, along with your normal qualification and close rates. Judge every change against that baseline.
That baseline discipline is what makes an improvement claim credible. Daryl W.'s Meta ads rose from 111 to 315 leads per month, and cost per lead fell from $106 to $43. Those numbers mean something because the starting point is known. A cost-per-lead drop only counts if the new leads also convert downstream at a comparable rate.
When Attribution Misleads Your Budget
Attribution doesn't just measure causality imperfectly. In the wrong places, it reverses the conclusion. Some buyers would've converted without seeing an ad, and the platform still credits the ad if that buyer clicked or viewed it inside the window.
The pattern is most likely in three places.
- Branded search: The buyer already knows your name, so a prior impression can collect credit for intent that search, word of mouth, or an earlier visit created.
- Retargeting: High-intent visitors are close to buying, which makes attributed ROAS look excellent even when the ads add little.
- Already high-intent purchases: Repeat buyers and people in an active buying cycle convert at high rates with or without exposure.
A positive attributed ROAS can coexist with weak incrementality. That's not a paradox. It means the platform found people who were likely to convert and recorded those conversions, without proving the ads caused enough of them to cover the spend.
Attribution can also understate value. Beliani reported that data-driven attribution undervalued Meta's contribution by as much as 64%, and its calibrated measurement led the company to double Meta investment in 2025. That's a Meta-published case study, so treat it as directional rather than universal. Its value is that it shows the error can run in the opposite direction from the one most advertisers worry about.
Both errors produce the same kind of budget mistake. You shift spend toward users who were already likely to convert because their attributed CPA looks efficient. Then you cut upper-funnel campaigns that create demand earlier, because their value arrives later under another channel's name. Over a few cycles, the account gets better at harvesting demand and worse at creating it.
Three questions for any campaign: Does it generate incremental demand, does that demand stay profitable, and does the result persist after creative fatigue or a budget change?
Repeat a holdout test whenever the audience, creative, offer, geography, or optimization event changes materially. Lift isn't a fixed property of Facebook as a channel. It's a property of this campaign, shown to this audience, against this counterfactual media mix.
The contrarian conclusion isn't that Facebook ads fail. It's that "works" is incomplete unless you measure it against a no-ad counterfactual. Once you adopt that standard, does advertising on Facebook work becomes a question you can answer for your own account instead of borrowing someone else's average.
How to Run a Lift Test Before You Scale Spend
A lift test is useful only if its result can change a budget decision. Set it up to answer one question: did the campaign generate conversions that would not otherwise have happened?
The process infographic below shows the sequence.
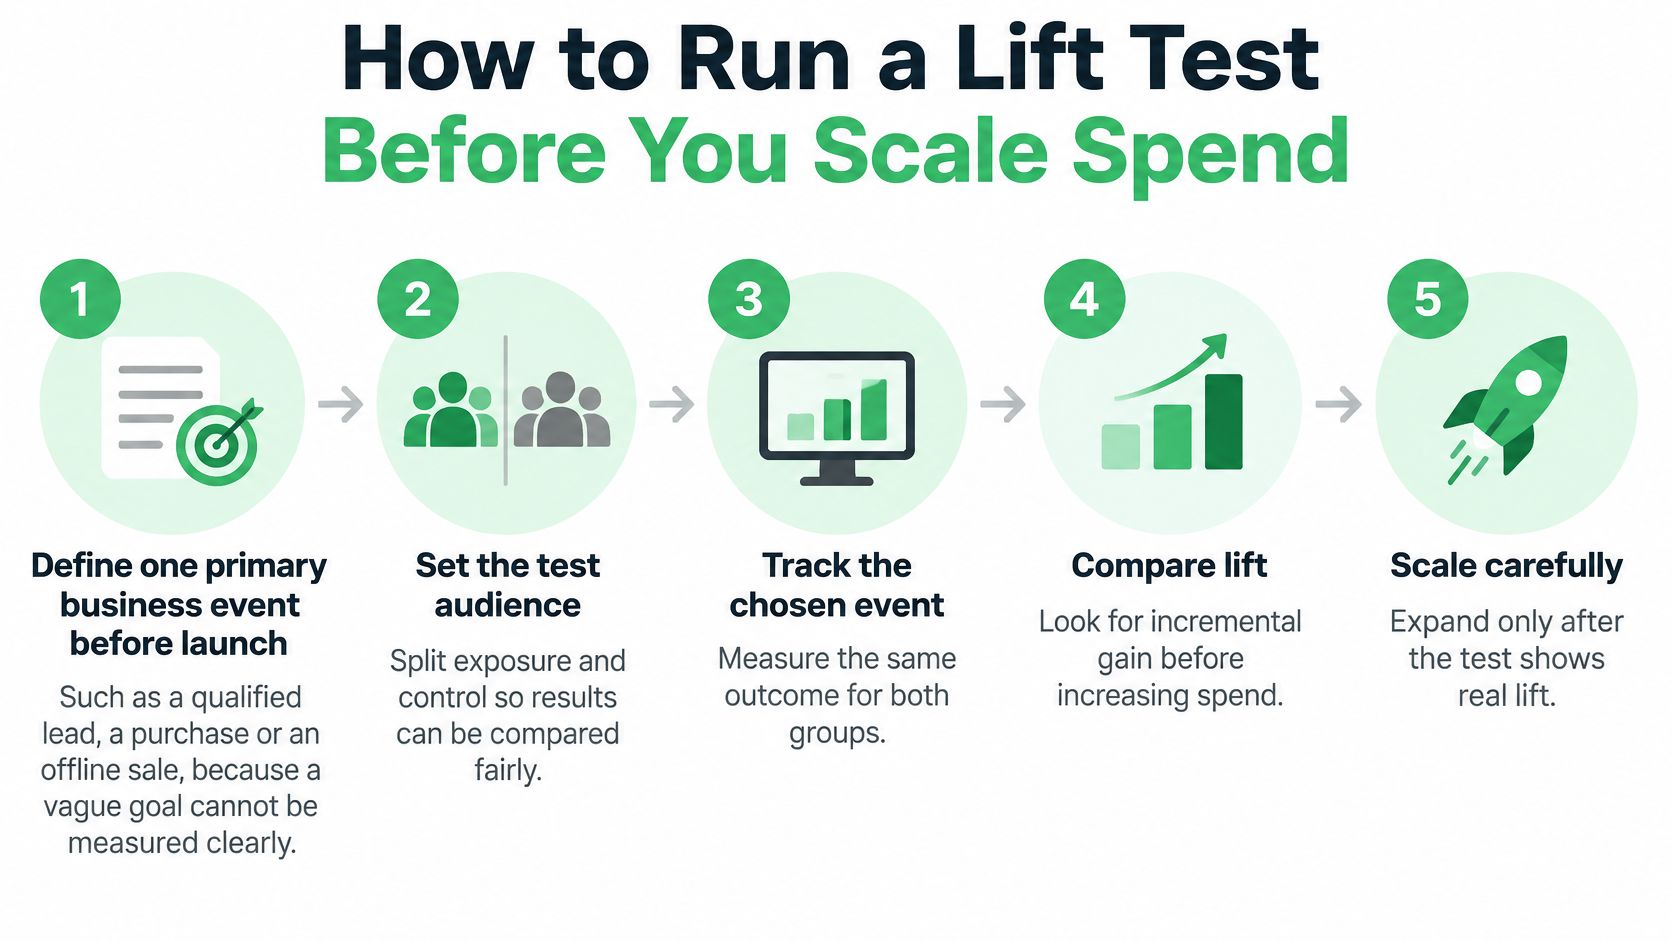
The Six Steps
- Choose one primary business outcome. Define it before launch: a qualified lead, a purchase, or an offline sale. Several competing endpoints make it easier to emphasize whichever result looks best after the test.
- Check that tracking captures each outcome once. Confirm that browser and server events do not count the same purchase twice, and that offline outcomes are matched consistently. Inconsistent tracking can distort the comparison between test and holdout groups.
- Set a budget and test length that can support statistical significance. Meta recommends allowing enough budget and time to reach that threshold. Smaller tests may still provide useful direction, but treat their results as directional rather than conclusive.
- Hold the audience, creative, and offer steady. A mid-test change alters the campaign being measured. If you need to fix a broken landing page, restart the measurement window so the result reflects a consistent setup.
- Compare incremental cost per conversion with your business threshold. Divide test spend by the additional conversions identified against the holdout. A scale case depends on whether that cost fits your margin or acceptable cost per qualified lead.
- Check the confidence interval before deciding. If it includes no lift, the result is inconclusive. Extend the test, increase volume, or repeat it under a more consistent setup instead of treating uncertainty as proof of success.
Test timing matters. Paid ads can send leads once they are live and approved, while SEO and AI search visibility build over months. That faster feedback does not make a short test conclusive: delivery may still be settling, and some outcomes take longer to appear.
Assess the primary event over the full test window, then check search and CRM outcomes for the same period. More incremental conversions do not necessarily mean better business results if lead quality has fallen.
When the available budget is limited, narrow the question to one market or offer and extend the test if practical. Label the result directional in reports, and avoid using it as precise evidence for a larger budget decision.
Warning Signs That Facebook Ads Are Not Working
A rising cost per lead over several weeks can signal creative fatigue or audience saturation. Before changing the campaign, check whether ads are reaching the intended audience and whether conversions are being tracked correctly. A delivery problem and a measurement problem call for different fixes.
Facebook Ad Symptoms, Likely Causes and First Checks
| Symptom | Likely cause | First check |
|---|---|---|
| Cost per lead rising over several weeks | Creative fatigue or a saturated audience | Review frequency and refresh the creative |
| Leads that never qualify | Loose targeting or a weak offer | Compare lead quality by campaign in the CRM |
| Strong ROAS in Ads Manager, flat revenue | The campaign may receive credit for buyers who would have converted anyway | Compare attributed results with incremental lift |
| Conversions fall after a budget increase | Lower marginal return as spend saturates | Compare marginal ROAS before increasing spend again |
| Good clicks, weak conversions | Mismatch between the ad and landing page | Check the offer match and page load speed |
Once delivery and tracking are sound, identify where the problem sits. Use the Meta ads wasted spend workflow to examine whether waste is concentrated in a few ad sets or spread across the account. To evaluate your launch campaign results, compare outcomes against the campaign objective rather than relying on a single account-wide number.
Report by cohort, objective, and market. Track reach, incremental conversions, cost per qualified lead, payback period, and marginal ROAS as spend changes. Blended ROAS can conceal the point where additional budget stops producing enough return.
Strong clicks with weak conversions often point to a gap between the ad's promise and the landing page. Check that handoff before buying more traffic.
Check the cross-channel footprint too. Ads may prompt branded searches or direct visits that appear in other channels' reports. Compare Meta, analytics, and Search Console data before deciding that a campaign is failing.
Confirm the Scale Decision Before Moving Budget
You don't need a bigger dashboard at this point. You need a decision rule that survives a good ROAS screenshot.
- Scale: Incremental profit stays positive, and CRM outcomes confirm the new leads or buyers are as good as your baseline cohort. Increase budget in steps and re-measure marginal return.
- Hold: The result is inconclusive, the interval includes no lift, or volume is too low. Extend or repeat the test instead of reallocating on a hunch.
- Cut or reduce: Incremental profit is negative, even if attributed ROAS looks strong. Attributed efficiency doesn't rescue a campaign that adds nothing.
Every one of those decisions needs a human checkpoint. With our process, nothing goes live and no ad budget changes until the client approves it. That approval gate matters because the most expensive mistakes aren't bad ads. They're fast, confident reallocations based on a number nobody challenged.
Use the Meta ads budget shift workflow to preview a proposed move before it happens. Bring the ad account, analytics data, and CRM outcomes into one review, state the expected incremental effect, and record who approved the change and why. Connecting Google Ads takes two minutes. You authorize once at notfair.co, then open an AI client and ask questions about the account, which makes the search side of the cross-channel check quick to pull into the same session.
The Free plan includes diagnosing account issues, drafting campaign changes, previewing bid, budget, keyword, audience, and ad edits before approval, and community support. This provides the diagnostic work you need before a scale call, without handing the budget decision to an automated rule.
End every review with one question, asked out loud and answered in writing. What did this spend cause that wouldn't have happened otherwise? If nobody can answer it with a counterfactual, you don't have a scale decision yet. You have a correlation with a budget attached.
Connect your Meta, Google Ads, GA4, and CRM accounts through NotFair to diagnose whether your Facebook campaigns are causing incremental leads or only claiming credit for them. You'll get live account reads, drafted campaign changes with clear diffs, and approval-gated budget moves so nothing changes until you approve it. Start by asking whether your best reported campaign still looks profitable against a no-ad counterfactual, then scale only the ones that do.