

The most popular advice about reporting Facebook ads is also the least useful: “Meta and GA4 will never match, so pick one and move on.” That approach turns a known measurement difference into an excuse for weak governance. The numbers don't need to match, but your team does need a defensible explanation of what each number represents, which outcome controls budget decisions, and how much causal confidence you should place in platform-reported ROAS.
Reliable reporting separates four questions. Did Meta deliver the ads? Did people interact with them? Did a platform attribute a conversion? Did the advertising create incremental business value? Those questions require connected data, fixed definitions, mature attribution windows, and an operating process that can detect waste while there's still time to act.
Table of Contents
- Separating Delivery Scale from Campaign Efficiency
- Mastering Attribution Windows and Time-Series Data
- Reconciling Meta Ads Manager with GA4 and CRM Data
- Automating Live Data Pipelines and AI Diagnostics
- Proving Causal Impact with Incrementality Testing
- Establishing Governance and Audit Protocols
Separating Delivery Scale from Campaign Efficiency
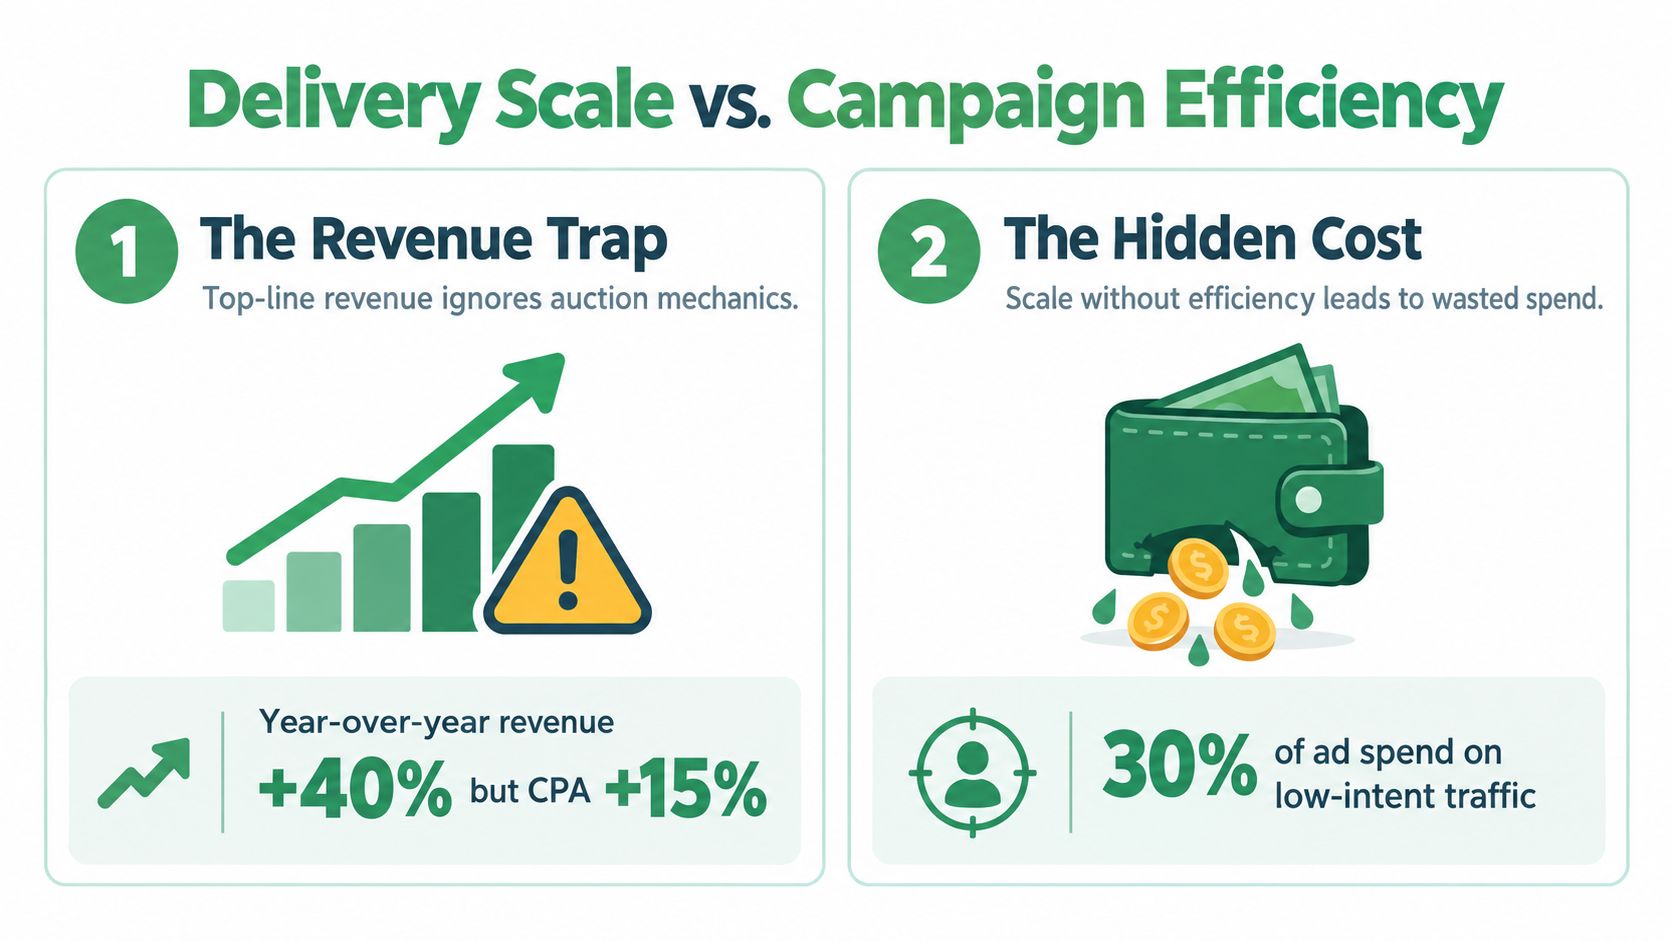
Big revenue numbers inside Ads Manager often hide the underlying problem. Delivery can expand while campaign economics get worse.
Meta's 2024 filing shows $160.633 billion in advertising revenue, up $28.685 billion, or 22%, from 2023. In the same period, ad impressions increased 11% and the average price per ad increased 10% (Meta's 2024 results). For advertisers, that is a reminder to separate what the platform was able to sell from what your account was able to produce efficiently.
More delivery creates more chances to earn attributed conversions. Higher auction prices can raise spend even when targeting, creative, and conversion quality are flat or slipping. If reporting stops at platform revenue or ROAS, teams miss the difference between scale and efficiency, and they end up defending spend that got broader distribution rather than better business results.
Build two views instead of one blended score
A useful report places delivery scale beside efficiency and outcomes. It does not compress everything into one headline number.
| Delivery scale | Efficiency and business outcome |
|---|---|
| Impressions | Spend |
| Reach | CPM |
| Frequency | Clicks and click-through rate |
| Ad-set and campaign delivery | Cost per click |
| Placement distribution | Conversions and cost per result |
| Purchase value and ROAS |
Use the split to diagnose cause, not just summarize performance. If purchases go up while reach stays flat and frequency climbs, the account may be extracting more from the same audience rather than finding new demand. If spend rises because CPM rises, that calls for a different response than a spend increase caused by broader delivery into additional placements.
Frequency deserves particular attention. A higher conversion total can come from broader reach, repeated exposure to a narrow audience, a larger budget, or changed auction conditions. Those are not interchangeable situations. One may justify expanding prospecting. Another may require creative rotation, tighter audience controls, or a check on whether the conversion event is pulling in weaker intent.
Practical rule: Never present year-over-year revenue without its delivery and cost context. Pair revenue with impressions, reach, frequency, spend, CPM, clicks, conversions, cost per result, and ROAS.
This is the operational baseline for a defensible measurement protocol. Keep platform attribution in one view. Judge business impact in another. Delivery metrics explain how Meta distributed spend. Efficiency metrics show what that distribution cost. The next reconciliation step is to compare those platform outcomes against qualified leads, recorded purchases, new customers, and CRM revenue, so attribution credit does not get mistaken for causal lift.
For audits, start with three questions. Did spend rise because the team intentionally scaled, because auction prices changed, or because delivery spread into weaker inventory? Then test that answer against downstream records, not only Meta's conversion value. If low-intent traffic or placement waste is hard to isolate, review common patterns of Facebook Ads wasted spend and turn the delivery report into a specific action list.
Mastering Attribution Windows and Time-Series Data
A conversion report is a time series with a crediting rule attached. If either part changes, the comparison changes.
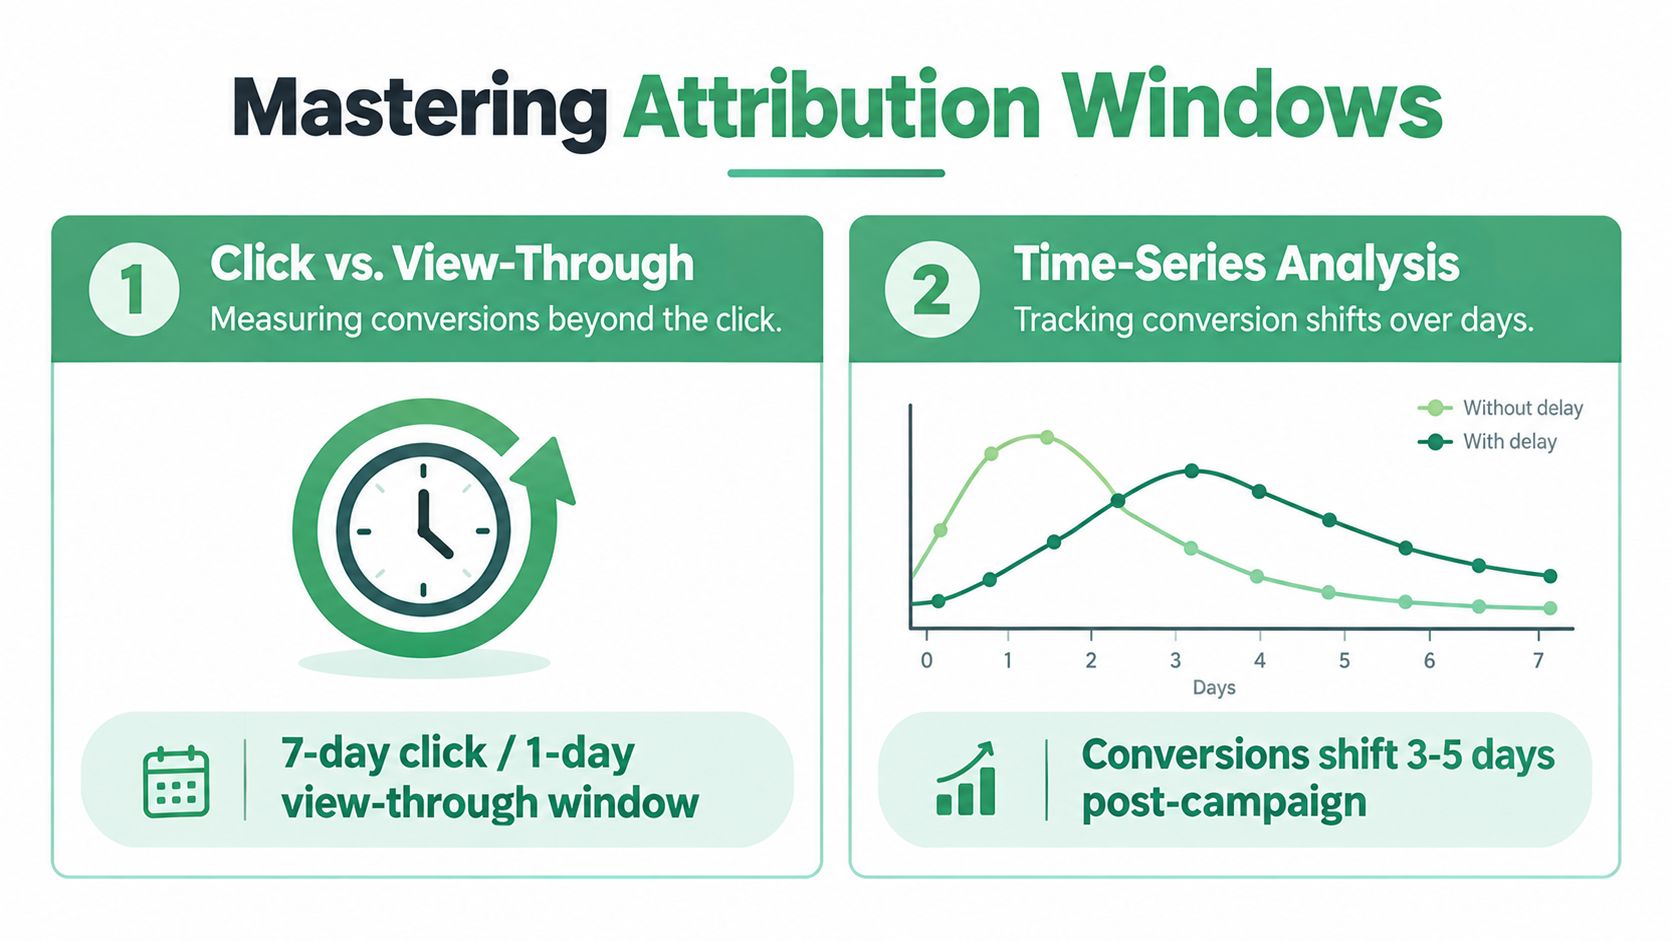
Meta can associate a conversion with the date of the ad impression that received credit. The attribution setting determines how long after a click or view that interaction can receive conversion credit. Common configurations include 1-day-click, 7-day-click, 1-day-view, 7-day-view, and 28-day-view, although available settings can change over time (Meta Ads reference documentation).
That means two reports with the same campaign and date range can produce different conversion totals without either report being technically broken. One may include view-through credit, another may use click-through credit, and a third may organize results by conversion date rather than impression date.
Freeze the reporting contract
Every scheduled extract should preserve the fields that determine how someone will interpret the result:
- Date range: Store the start and end dates used in the request.
- Attribution setting: Record the explicit window, rather than relying on an account default.
- Conversion event: Name the event, such as purchase, lead, or another configured action.
- Date convention: State whether rows are organized by impression date or conversion date.
- Account context: Preserve currency, timezone, breakdowns, account, campaign, ad set, or ad level.
- Extraction metadata: Keep the timestamp of the data pull and the source request parameters.
Databricks' Meta connector documentation notes that Insights data uses the account's default attribution settings unless action_attribution_windows is overridden. It also warns that recent dates can remain incomplete until the selected conversion window closes (Meta Ads connector concepts).
In practice, run parallel views instead of accepting the default by default. A decision view might use click-through attribution, while a reconciliation view separates view-through conversions. Pull the same date range with explicit settings such as 7d_click, 1d_click, and 1d_view, then label each result clearly. Don't blend them into one conversion column.
Treat recent performance as provisional
The newest dates are the most dangerous dates in a performance report. Their spend is known, but their conversion record may still mature. If you rank campaigns by a recent CPA or ROAS and make a budget move immediately, you may compare a nearly complete older period with an incomplete newer period.
A defensible pipeline re-ingests trailing dates until the selected attribution window has elapsed. It also keeps historical comparisons consistent by holding the timezone, attribution convention, conversion event, and breakdown structure constant. Validate breakdown combinations before production use, because unsupported combinations can return missing or fragmented rows.
This approach won't make every platform report agree. It makes disagreements explainable. Stakeholders can see whether a change came from conversion maturation, a different attribution window, a new event definition, or an actual performance shift.
Reconciling Meta Ads Manager with GA4 and CRM Data
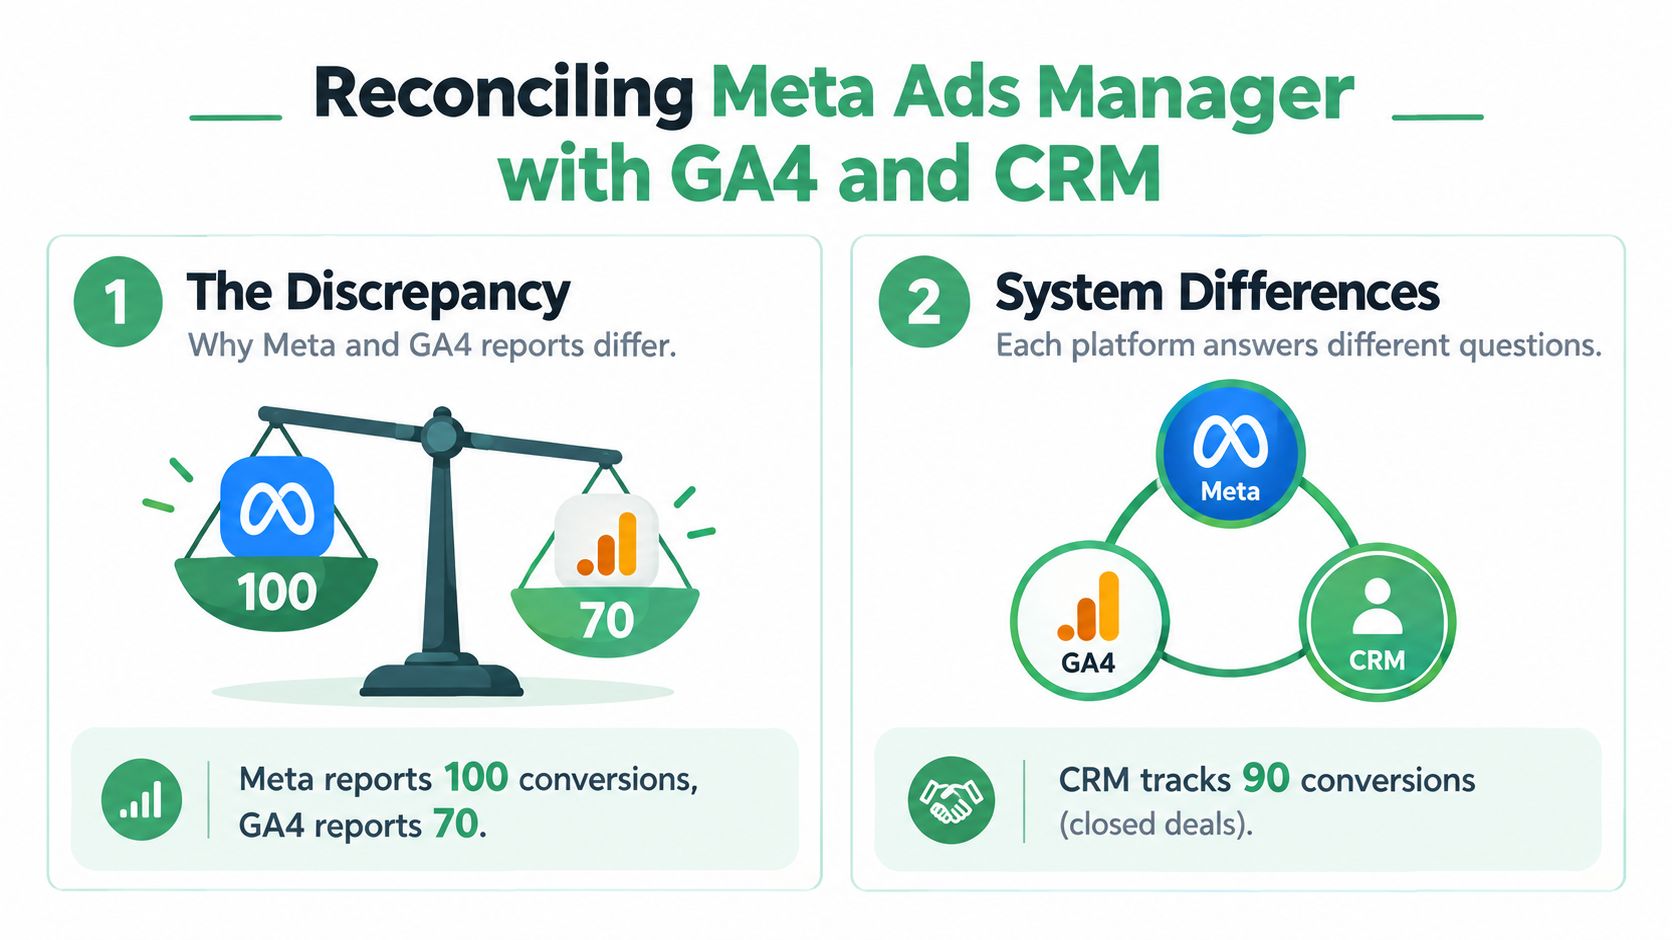
Meta Ads Manager, GA4, and a CRM aren't competing scoreboards. They observe different parts of the customer journey and apply different rules.
Meta can credit click-through and view-through conversions within its configured attribution window. GA4 generally needs a trackable site session and applies its own attribution logic. The CRM may record a lead, qualified opportunity, or purchase only after identity resolution and sales-process updates. Consent status, browser restrictions, landing-page failures, cross-device behavior, and modeled conversions can affect each layer differently.
The useful question isn't “which platform is right?” It is which system answers which business question?
Use a reconciliation ladder
Create a reporting table that keeps measurement layers separate instead of forcing a single conversion number:
| Layer | What it can answer | Typical limitation |
|---|---|---|
| Meta Ads Manager | Which conversions Meta attributed to ad interactions | Platform-defined credit, including view-through activity |
| GA4 | Which consented, observable site activity received analytics credit | Lost sessions, consent restrictions, and different attribution logic |
| CRM | Which contacts became qualified outcomes or recorded revenue | Delayed updates, identity matching, and incomplete source data |
| Incrementality test | Whether exposure changed the outcome relative to a control group | Requires design, randomization, and adequate measurement discipline |
For each campaign, preserve the platform-reported result, consented site-observed result, CRM-qualified outcome, and any available incrementality benchmark. Don't subtract the columns and label the remainder “tracking error” until you've checked event definitions, date conventions, timezone, landing-page behavior, and consent conditions.
A smaller Meta to GA4 gap isn't automatically better. It may reflect stricter consent conditions, undercounted sessions, or lost signal. Conversely, a larger gap may reflect view-through credit or cross-device behavior rather than a broken tracking implementation.
Make the CRM the quality filter
Meta can help identify delivery and attributed response, but the CRM should answer whether the response became commercially meaningful. For lead generation, distinguish raw leads from qualified leads, opportunities, and recorded revenue. For ecommerce, compare platform purchase value with verified orders, refunds, customer identity, and new-customer status.
A dashboard needs more than attractive charts. Teams designing an executive view can borrow useful layout ideas from these sales dashboard examples for 2026, but the underlying model should retain the source and definition of every metric. A polished visualization won't repair inconsistent event naming or mixed attribution windows.
Use a short reconciliation note beside every material variance:
- Definition: What does each system count as a conversion?
- Eligibility: Did consent or tracking conditions limit observation?
- Timing: Are the reports using impression date, conversion date, or CRM close date?
- Attribution: Which click and view windows apply?
- Quality: How many outcomes reached a qualified or revenue stage?
- Causality: Is there a holdout or lift estimate, or only attributed performance?
Keep the technical implementation documented in your Google Analytics platform documentation, and make the business decision rule explicit. For example, Meta can govern delivery optimization, GA4 can help diagnose site behavior, and CRM-qualified revenue can govern channel-quality decisions. The exact ownership depends on the business, but leaving it undefined guarantees recurring arguments about whose number is “correct.”
Automating Live Data Pipelines and AI Diagnostics
Manual CSV exports create a delayed picture of a live auction. They can support a one-off investigation, but they make a poor operating system for budget decisions. By the time someone downloads, cleans, joins, and reviews the file, delivery may have shifted and the original cause may be harder to isolate.
A live pipeline should read the account at query time, preserve the raw response, and produce a decision layer without overwriting the source. The objective isn't to automate every edit. It's to make diagnosis timely while keeping changes controlled.

Start with an immutable reporting layer
Capture Meta Insights at a fixed level, such as account, campaign, ad set, or ad. Store spend, impressions, reach, clicks, purchases, revenue, and frequency together with the extraction timestamp, date range, currency, timezone, attribution settings, and requested breakdowns.
Then add validation before any AI interpretation:
- Schema checks: Confirm required fields exist and data types haven't changed.
- Freshness checks: Flag accounts whose latest read is unexpectedly old.
- Completeness checks: Identify recent dates that are still within the attribution maturation period.
- Join checks: Confirm campaign and ad-set identifiers remain stable across extracts.
- Currency checks: Prevent values from different currencies entering the same comparison.
- Breakdown checks: Reject unsupported combinations rather than automatically accepting fragmented rows.
The pipeline should maintain both raw and normalized tables. Raw data supports audit and reprocessing. Normalized data supports reporting, trend analysis, and connections to GA4 or CRM outcomes.
Turn diagnostics into reviewable proposals
An AI diagnostic layer can compare current delivery with the fixed reporting contract, identify unusual cost or outcome movements, and rank findings by spend at risk. It can also inspect campaign structure, budgets, ad sets, ads, creatives, and delivery status when the connector exposes those fields.
The safe workflow is deliberately asymmetric:
- Read live data.
- Explain the suspected issue and supporting fields.
- Draft a proposed change.
- Show the exact diff.
- Require human approval.
- Write the change and log the result.
- Provide a reversible path.
NotFair is one option for this operating model. Its hosted Meta Ads MCP provides live reads for Facebook and Instagram account data, including campaign structures and performance metrics, while approval-gated write tools can support pauses and budget moves with explicit diffs, logging, and one-call undo. The same principle can be implemented with an internal data stack, provided the permissions and audit controls are equally clear.
AI shouldn't decide that a low recent ROAS proves a campaign is failing. It should check whether the date range is mature, whether attribution settings changed, whether tracking degraded, and whether CRM quality supports the platform result. A fast wrong diagnosis is more dangerous than a slow report, especially when the proposed next step changes live budgets.
Proving Causal Impact with Incrementality Testing
Attribution records a qualifying relationship between an ad interaction and a conversion. It doesn't prove that the ad caused the sale. That distinction becomes critical in remarketing, branded audiences, and other situations where people may already be close to converting.
For high-stakes budget decisions, treat platform conversions as attributed outcomes, then add an incrementality layer. A campaign can look efficient in Ads Manager while creating limited incremental demand if the audience would have converted without exposure.
Design the test before opening the report
A defensible holdout or Conversion Lift design needs a written protocol. Define:
- One primary conversion: Avoid switching the success event after seeing the results.
- Eligibility rules: Specify which users or accounts can enter the test.
- Scope: Record the geography or audience boundary.
- Test duration: Set the observation period before launch.
- Minimum detectable lift: Establish the sensitivity the test needs.
- Decision threshold: Define what result would change budget allocation.
- Random assignment: Place eligible users or accounts into exposed and control groups.
- Contamination controls: Prevent control users from receiving the tested exposure through another route.
Analyze the intention-to-treat population, not only people who clicked or completed an engagement. Report absolute lift, relative lift, incremental conversions, confidence intervals, and incremental CPA or ROAS. Keep standard click-through and view-through results in separate columns so attributed efficiency doesn't masquerade as causal efficiency.
Use research as a warning, not a calibration factor
A summary of Meta's large-scale measurement research reported 663 experiments and median randomized lifts of 29%, 18%, and 5% across upper-, middle-, and lower-funnel outcomes. Propensity-based estimates were substantially larger at 173%, 176%, and 64% for the same categories (summary of the measurement research).
The lesson isn't to multiply every attributed conversion by a correction factor. Different campaigns, audiences, outcomes, and designs produce different evidence. Use randomized results to calibrate the specific decision where the test applies, document exclusions and power, and preserve the raw exposure, control, and conversion counts.
If a lift test isn't feasible, label the result attributed ROAS, not incremental ROAS. Triangulate it with CRM revenue, new-customer outcomes, audience suppression, geo experiments, or time-series evidence. The uncertainty should affect how aggressively you scale, particularly when the reported efficiency comes from high-intent audiences.
A reported conversion tells you that Meta claimed credit. A lift result tells you what changed because exposure was assigned.
Establishing Governance and Audit Protocols
A live reporting pipeline without governance only moves risk faster. Multiple people, scripts, and AI agents may read the same account, but only approved actors should change budgets, pauses, targeting, or campaign structure. The reporting environment must preserve enough context to reconstruct what happened and why.
Define the operating controls
Use a written checklist for every account:
- Access roles: Separate read access from write access, and grant write permissions only to people or services that need them.
- Approval gates: Require a named reviewer before budget moves, pauses, structural edits, or event changes.
- Explicit diffs: Show old and proposed values, affected campaigns, rationale, and expected risk before execution.
- Audit logs: Record actor, timestamp, account, object, field changes, approval, and execution result.
- Reversibility: Store the prior state so an approved edit can be undone quickly.
- Data contracts: Define metric names, attribution windows, timezones, currencies, and conversion events.
- Credential hygiene: Use hosted OAuth or controlled service credentials instead of sharing personal login details.
- Incident handling: Document what happens when a pipeline is stale, a schema changes, or an unauthorized edit appears.
A data-quality reference such as Pipecorn's guide to improve sales data quality is useful when you need to formalize ownership, validation, and exception handling across marketing and sales records. The same discipline belongs in paid-media reporting. A CRM outcome is only as trustworthy as the process that updates its stage, owner, value, and close date.
Review the report as an operational artifact
A weekly or daily report should answer more than “what happened?” It should show whether the data is complete, which changes occurred, and what decision is now recommended. Include a data-status panel with freshness, maturity of recent dates, attribution configuration, and reconciliation notes.
For AI-assisted operations, use a separate permission path for reads and writes. A system may query live account data freely while requiring approval for any mutation. NotFair's Meta Ads MCP follows this pattern with read access for analysis and approval-gated campaign operations, but the broader principle applies to any internal or third-party implementation.
Don't let automation hide uncertainty. If the pipeline detects a conversion drop, it should distinguish between a genuine outcome change, delayed attribution, tracking loss, consent variation, and an incomplete extract. If it recommends a budget move, the proposal should include the evidence, affected objects, expected side effects, and rollback state.
Governance works when a finance lead can challenge ROAS, an analyst can reproduce the extract, and an operator can reverse a change without reconstructing the entire account manually. That standard is stricter than a dashboard, but it protects the decisions the dashboard is supposed to support.
NotFair connects AI agents to Meta Ads, GA4, and CRM data for live diagnosis, structured reporting, and approval-gated campaign operations with explicit diffs and reversible changes. If your team is still reconciling stale exports by hand, visit NotFair to see how a controlled live-data workflow can make Facebook Ads reporting more defensible.