

The most popular advice about ACOS vs ROAS is that they're interchangeable, so you can pick whichever format feels more intuitive. The math is interchangeable. The business decision isn't. A reported return can look strong while losing money after costs, and a low advertising cost can still reflect sales that would have happened without the ad.
A useful target starts with two questions: Which revenue figure are you measuring, and what margin must that revenue protect? Then test whether the advertising caused incremental sales. Without those checks, choosing between a percentage and a multiple is just choosing how to display an incomplete answer.
Table of Contents
- Why ACOS vs ROAS Is the Wrong Question
- What ACOS and ROAS Actually Measure
- The Math and Where It Stops Working
- Choosing the Right Metric by Campaign Type
- Break-Even Targets From Contribution Margin
- Attribution and Incrementality Tests
- A Practical Reporting and Decision Template
Why ACOS vs ROAS Is the Wrong Question
ACOS and ROAS are two ways of expressing ad-attributed revenue relative to spend. That makes them mathematically convertible, but it doesn't make either one a profit metric. Both can use the same attributed sales figure and still tell you little about what remains after product costs, fulfillment, platform fees, discounts, returns, or creative expenses.
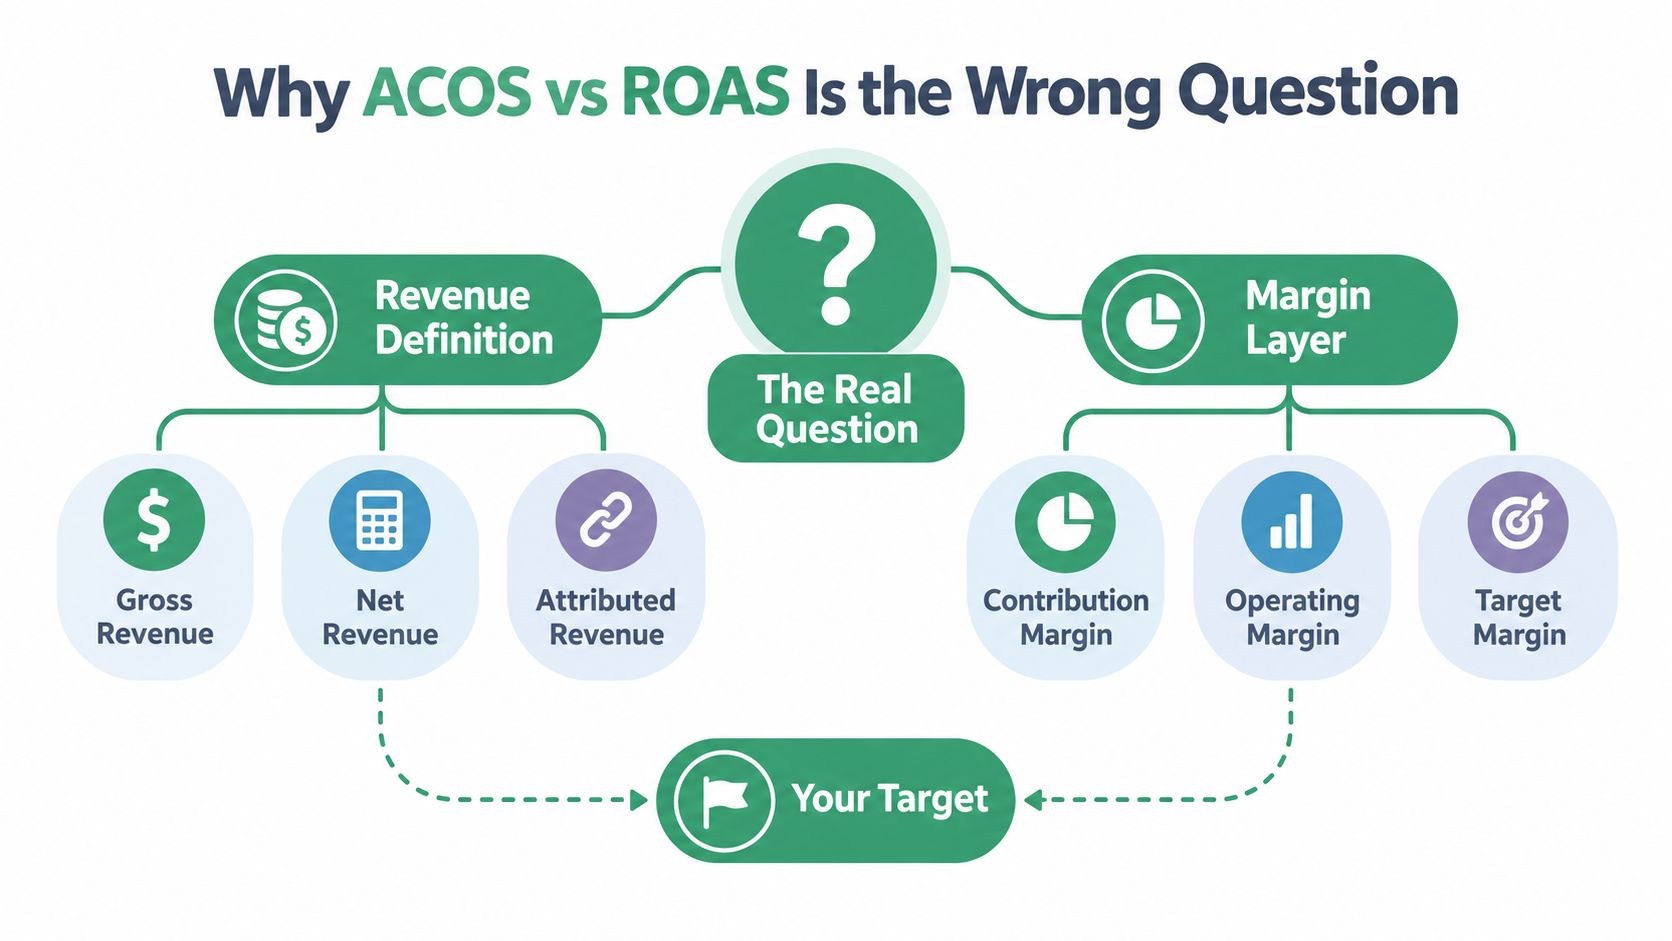
A 4.0x ROAS sounds efficient until you compare the revenue it reports with the contribution margin available to pay for advertising. If the campaign's ad-attributed revenue doesn't leave enough contribution after variable costs, the multiplier can conceal a loss. A 20% ACOS can be misleading in a different way: it may look disciplined while giving credit to ads for purchases that would have happened anyway.
The more useful question is not which metric is better. It's which revenue definition and margin layer should set your target? Decide whether the report uses gross or net revenue, clarify what the platform attributes to ads, and calculate the contribution left after variable costs. Then set the efficiency threshold against that contribution, not against a generic benchmark.
Reported efficiency isn't profit
Platform reporting answers a narrow question: how much attributed revenue is associated with the spend under that platform's measurement rules? It doesn't automatically subtract costs or establish causality. Treating a platform-reported return as profit invites the wrong budget decisions, especially when branded search, retargeting, or marketplace ads claim revenue from customers already close to purchasing.
For a practical target, start with contribution margin, the portion of revenue available after the variable costs relevant to the sale. Then consider incrementality: would those customers still have bought if the ads weren't shown? The first test tells you whether the attributed sales can cover advertising costs. The second tells you whether advertising deserves credit for those sales.
Decision rule: Choose the metric format your team can read quickly, but set the target using contribution margin and judge the channel using incremental contribution.
That's why the ACOS vs ROAS debate needs to move past preference. Reporting both is useful. Treating either one as a universal verdict is not.
What ACOS and ROAS Actually Measure
ACOS, or advertising cost of sales, expresses ad spend as a percentage of ad-attributed revenue. Amazon Ads defines it as ad spend divided by ad-attributed revenue, multiplied by 100. ROAS, or return on ad spend, expresses attributed revenue as a multiple of ad spend. The two formulas are inverses when ACOS is written as a percentage (Amazon Ads' ACOS guide).
Use one example to read both. If a campaign spends $50 and generates $100 in attributed sales, its ACOS is 50% and its ROAS is 2.0x. ACOS says advertising consumed half of the attributed sales revenue. ROAS says each advertising dollar generated two dollars in attributed revenue. Neither says how much profit remains.
Read the metric in the platform's language
ACOS is often an intuitive cost-control view for ecommerce teams: a lower percentage means less ad spend relative to attributed sales. ROAS is a convenient revenue-scaled view, especially where bidding systems optimize toward conversion value. Google Ads describes conversion value per cost as total conversion value divided by advertising-interaction cost, its direct efficiency analogue to ROAS. Its Target ROAS bidding strategy uses reported conversion values to adjust bids toward an average return goal, although individual auctions can perform above or below that target (Google Ads' explanation of Target ROAS).
The interface can make these measures look like different kinds of performance. They're not. If the underlying spend and attributed revenue are identical, the metrics describe the same relationship from opposite directions. Keep both values visible when teams use platforms that display different formats.
For marketers comparing revenue measurement across local campaigns, a contextual overview of advertising ROI for local service companies can help clarify how return is framed in a service-business setting. The same discipline applies: check the revenue definition before comparing results.
The key limitation remains: neither ACOS nor ROAS automatically includes the costs needed to calculate profitability. Read either as a reported efficiency measure, not as a complete financial outcome.
The Math and Where It Stops Working
The conversion is straightforward: ROAS = 100 ÷ ACOS, with ACOS entered as a percentage. A lower ACOS corresponds to a higher ROAS, and the underlying spend and attributed revenue stay the same.
| ACOS | ROAS |
|---|---|
| 20% | 5.0x |
| 25% | 4.0x |
| 50% | 2.0x |
This quick reference is useful when you're comparing dashboards or translating targets between teams. It stops being a reliable guide when the revenue figures behind the metrics don't match, or when the business needs a profit answer rather than an efficiency ratio.
What can change the reported result
Two platforms can show different ACOS or ROAS for the same campaign spend if they use different attribution windows, conversion-value rules, or revenue definitions. Including or excluding taxes and shipping can also alter the value assigned to a conversion. The reported efficiency may move even though media spend hasn't changed.
That's why a cross-channel report needs a consistent definition of revenue. Preserve the underlying spend and attributed-revenue values, document the attribution settings, and align date ranges before comparing platforms. If one report uses a broader conversion window or a different treatment of returns, its ratio isn't directly comparable with another platform's result.
The margin trap
A 4.0x ROAS means attributed revenue is four times ad spend. It doesn't mean the campaign earns four times its cost as profit. Product costs, fulfillment, platform fees, discounts, returns, overhead, and creative or agency costs may consume the revenue before advertising is accounted for. A campaign can therefore report a strong multiple while losing money.
For teams building a broader measurement practice, Willowood Ventures' ROI insights provide context for thinking about what sits behind an ROI figure. The practical point is simple: use the inverse math to translate formats, then move to contribution margin to assess whether the result makes economic sense.
If the revenue definition changes, the ratio changes with it. If the costs are missing, the ratio remains incomplete. Keep those two checks separate in reporting, and don't let a clean conversion between ACOS and ROAS stand in for a profitability calculation.
Choosing the Right Metric by Campaign Type
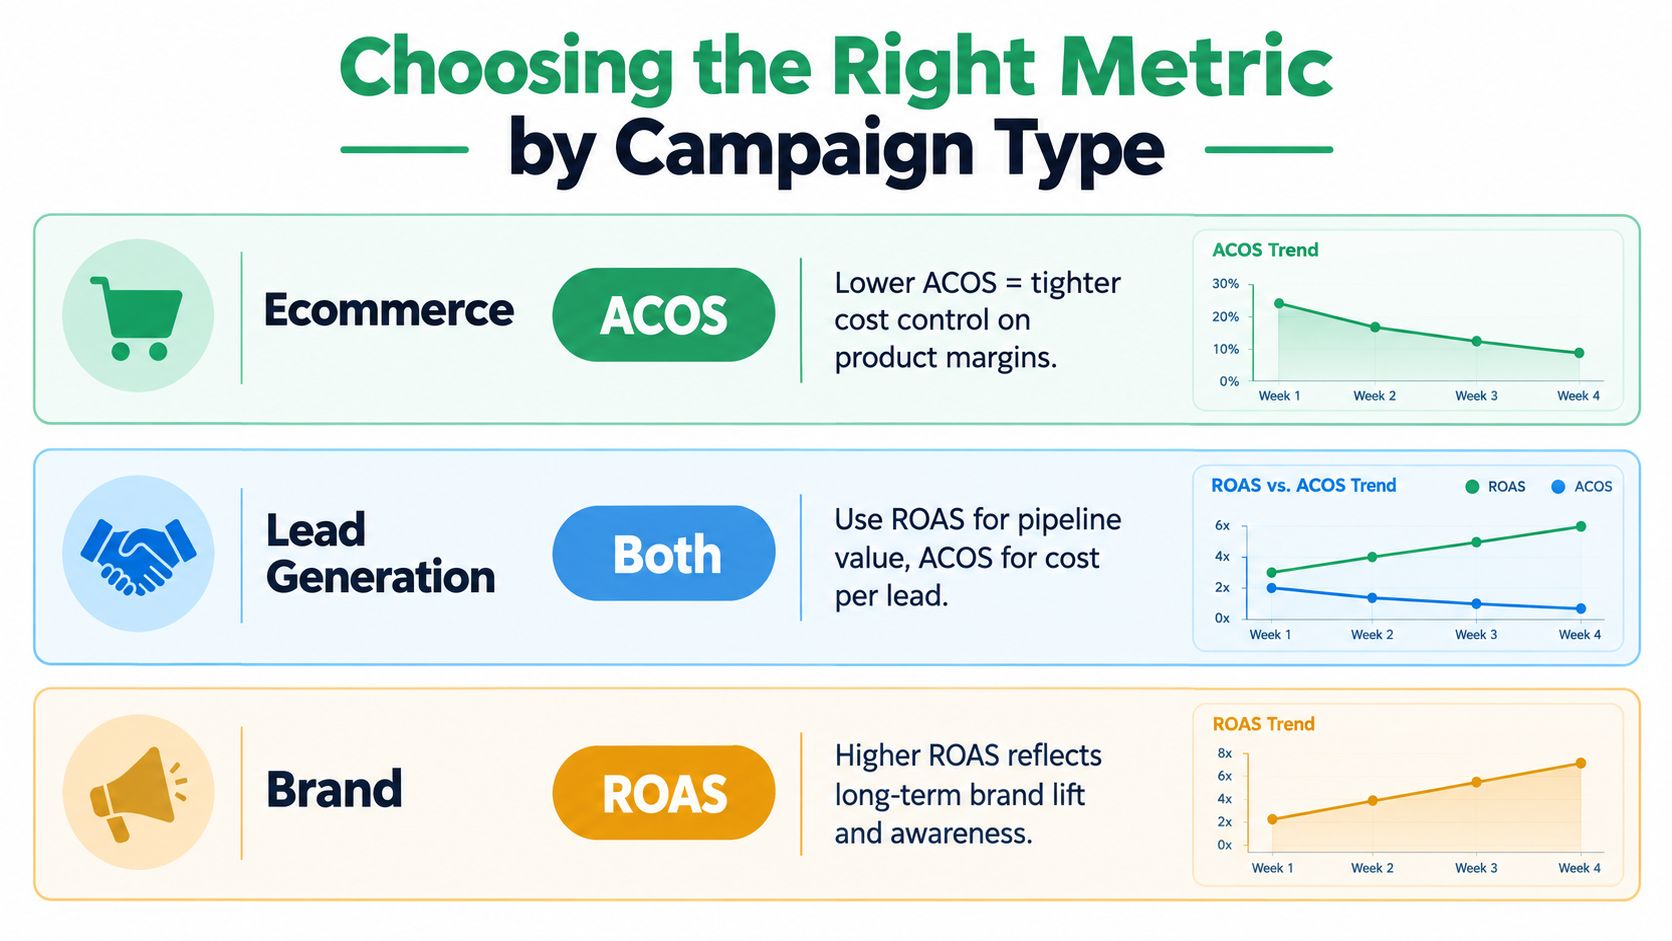
The right display depends on what the campaign is meant to accomplish and whether its conversion value is credible. For ecommerce cost control, ACOS often reads naturally against contribution margin. For revenue-scaled bidding, ROAS can be easier to use because it states how much attributed value the system is trying to generate per advertising dollar.
Ecommerce
For a product campaign, I'd put ACOS beside contribution margin when the primary decision is whether ad costs fit within product economics. The percentage is easy to compare with a margin-based limit. Keep ROAS visible too if the bidding platform or finance team works in multiples, but don't let a higher ROAS substitute for checking actual costs.
Marketplace reporting deserves extra scrutiny. The attributed revenue may not reflect returns, fees, or other costs in the way your profit model does. Set one revenue definition for campaign review, and make any difference from the platform's reported figure explicit.
Lead generation
For lead generation, neither metric is sufficient if the conversion value is just a form submission with no connection to lead quality or sales outcomes. ROAS can be useful when conversion values reflect pipeline or realized revenue. ACOS can help assess the cost relative to that value, but a cheap lead isn't necessarily a valuable lead.
Connect advertising data to CRM stages where possible. If Google Ads reports conversion value while the CRM shows whether leads progressed, you can distinguish a campaign that produces many low-value inquiries from one that contributes to sales. When values aren't trustworthy, use a cost metric tied to qualified outcomes instead of presenting an ungrounded ROAS as a business result.
Brand campaigns
Brand activity often has goals that don't fit neatly into short-term attributed revenue. A ROAS-focused view may capture conversions but miss the broader objective; ACOS may be low because the ads reach customers who already know the brand. Separate branded from non-branded activity, then evaluate each against its intended role.
Use ACOS when cost relative to product economics is the decision. Use ROAS when reliable conversion value is the optimization signal. Use neither alone to claim incrementality.
That distinction helps teams avoid turning a convenient dashboard column into a universal campaign score.
Break-Even Targets From Contribution Margin
Generic benchmarks don't know your product costs or operating model. Contribution margin gives you a break-even reference point: the revenue share left after variable costs that can go toward advertising before the sale stops contributing. From that, you can derive a break-even ACOS and ROAS.
Calculate your threshold
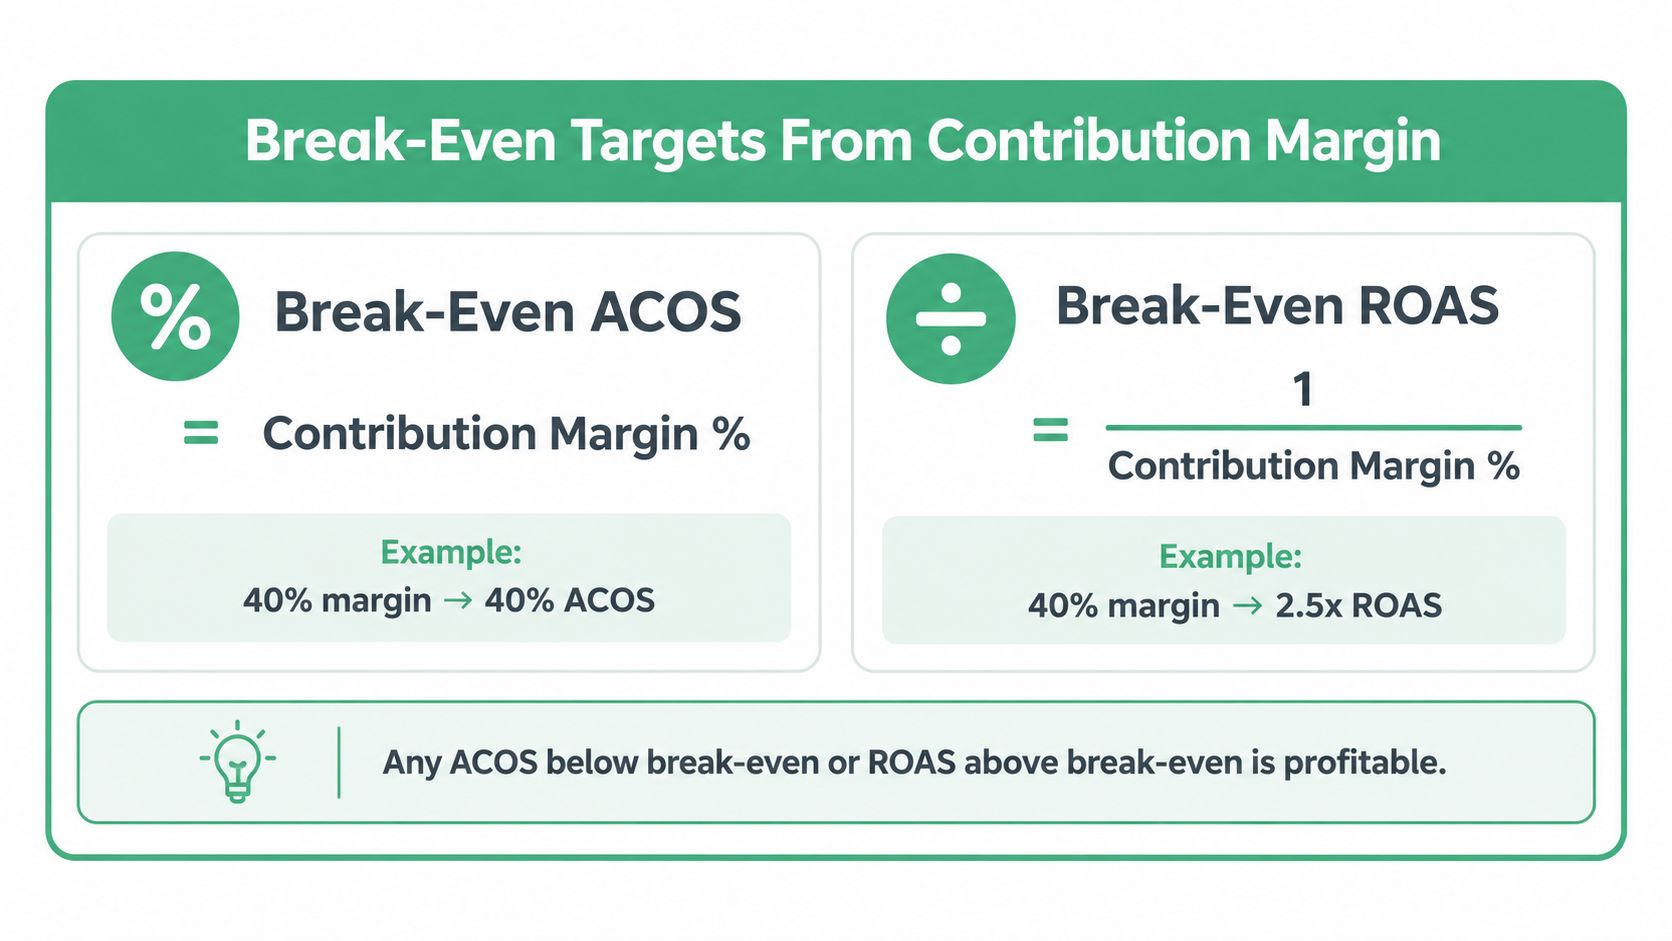
Start with the contribution margin percentage for the revenue definition you intend to use. Break-even ACOS is approximately equal to contribution margin, while break-even ROAS is the reciprocal of that margin expressed as a decimal. These are break-even limits, not profit targets. Fixed costs and any costs excluded from the contribution calculation still need to be considered.
Consider two businesses:
- A business with 30% contribution margin needs ACOS below 30%, or ROAS above 3.33x, to leave a contribution after advertising, before fixed costs.
- A business with 70% contribution margin can tolerate a much lower ROAS before reaching the same break-even point, because more of each revenue dollar remains available to cover ads.
The formulas are useful only if the margin definition is complete enough for the decision. If you leave out fulfillment, platform fees, discounts, returns, or other variable expenses, your calculated threshold will be too generous. Build the relevant costs into the contribution figure before setting a target.
Use benchmarks as context, not targets
Benchmarks vary with campaign type and measurement choices. Reported median Google Ads ROAS has ranged from 5.17x for Search to 2.57x for Performance Max and 0.12x for Display, which makes a single universal target a poor planning tool (Rule1's ROAS benchmark coverage). Those figures can help explain why campaign contexts differ, but they can't tell you whether your own campaigns are profitable.
Write the break-even line into your planning document, then set an operating target that leaves room for the profit the business needs. For a structured review of ecommerce campaigns and account setup, use a Google Ads ecommerce audit alongside your margin calculation.
The calculation is direct: break-even ACOS ≈ contribution margin; break-even ROAS = 1 ÷ contribution margin. Treat that as the floor for decision-making, not as proof that every campaign above it is delivering incremental profit.
An explainer can help your team align on the arithmetic before applying it to campaign targets:
Attribution and Incrementality Tests
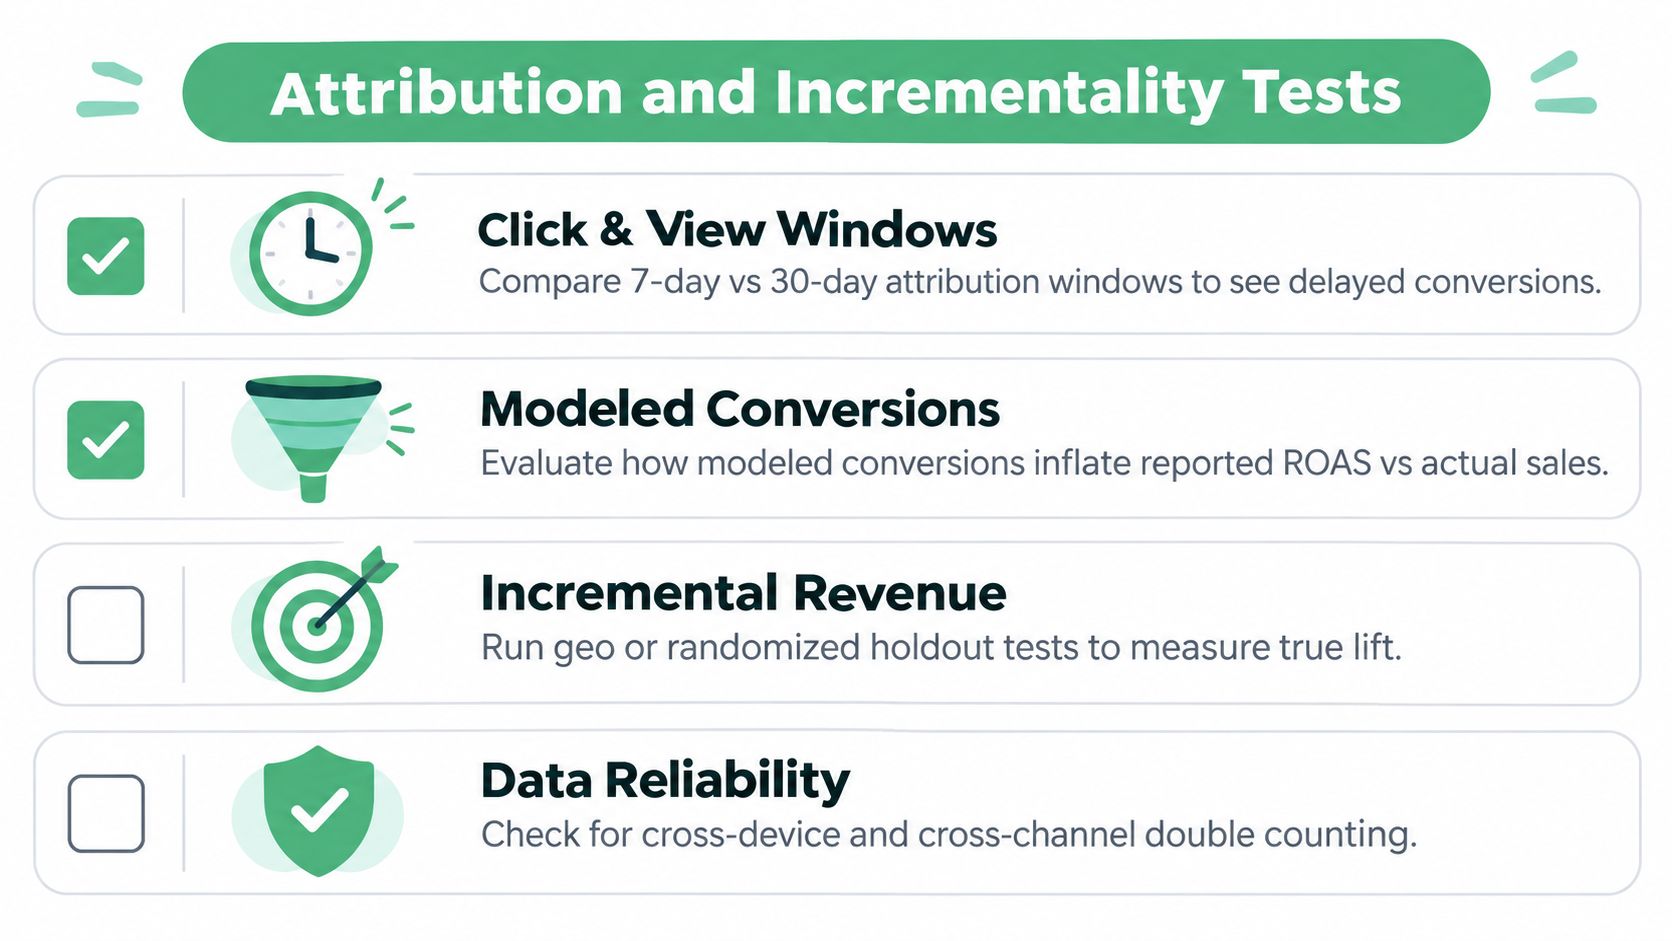
A platform's ROAS measures reported efficiency under its attribution rules. It doesn't prove that the ads caused the revenue. Click and view windows, modeled conversions, and platform-specific reporting rules can all change reported results. Historical targets may also lose relevance when auction conditions shift. Recent benchmark coverage reported ROAS declines across 13 of 14 industries in 2025, so historical performance shouldn't be carried forward without checking current conditions (DTC ROAS benchmark coverage).
Separate measurement from causality
Start by comparing the attribution settings across the platforms in your report. Check click and view windows, conversion-value definitions, modeled conversions, and whether multiple platforms can claim credit for the same purchase. Then separate branded from non-branded activity. Branded search and retargeting can report strong efficiency while capturing customers who were already close to converting.
Add a blended view. TACoS, calculated as ad spend divided by total revenue, helps show how advertising relates to the whole business rather than only to attributed sales. New-customer share and cohort payback add context about who the advertising brings in and whether the economics hold over time. These measures improve diagnosis, but none proves that advertising caused the result.
Test the counterfactual
The core question is practical: how much reported ROAS would disappear if the campaign stopped? Where feasible, use a randomized audience holdout or a geographic holdout to compare outcomes between exposed and unexposed groups. Evaluate incremental revenue and incremental contribution profit, not just platform-attributed sales.
For teams connecting campaign reporting to customer records, GolfRep's discussion of CRM matching to improve membership growth offers relevant context on the role of matching customer data to attribution. In your own workflow, check whether campaign conversions map to the right CRM records and whether cross-channel credit is being counted more than once.
If Google Ads conversion data is part of the decision, a Google Ads conversion audit can help identify tracking and value-definition issues before you trust the reported return. Use the platform metric as a signal, then use controlled tests to estimate what the signal means for the business.
A Practical Reporting and Decision Template
Build the report around the values that produce the ratios. For each campaign, keep spend, attributed revenue, attribution settings, ACOS, ROAS, contribution margin, and break-even threshold visible. Add paid and organic revenue beside the platform result, then separate branded from non-branded traffic so a strong blended number doesn't hide where the credit comes from.
A cross-platform comparison should preserve the underlying inputs before comparing outputs. Teams reviewing Google Ads, Meta, and marketplace activity can use a Google Ads cross-platform ROAS workflow to structure that comparison. If you use automation to diagnose or change campaigns, require review of proposed edits and keep an auditable record of what changed.
Use this decision checklist
- Define revenue: Specify whether the target uses gross, net, or platform-attributed revenue.
- Set the margin line: Calculate contribution margin and derive the break-even ACOS or ROAS.
- Split the traffic: Report branded and non-branded campaigns separately.
- Test lift: Use a holdout where feasible and compare incremental contribution, not just attributed revenue.
- Review consistently: Revisit attribution settings, costs, and performance together rather than adjusting targets to fit a dashboard.
This workflow keeps teams from confusing a ratio with a business result. When a campaign looks efficient, check whether its reported revenue is comparable, whether its margin clears the break-even line, and whether the sales are incremental.
NotFair provides hosted connectors that let AI agents read advertising, analytics, and CRM data, with approval-gated campaign changes, explicit diffs, and logged history. If you want to bring campaign diagnosis and cross-platform performance review into one workflow, visit NotFair.