

Meta ads reporting is not a screenshot of campaign results or a table of familiar metrics. It is a decision system that connects fresh data, agreed definitions, diagnostic paths, and accountable actions. For a paid media manager, agency strategist, or growth team, the useful question is not merely “What happened?” but “What should we investigate, who owns the decision, and what change is safe to make next?”
This distinction matters because an account can show a healthy-looking cost per lead while lead quality declines, or show weak platform conversions while the sales team is still receiving valuable opportunities. Good reporting makes those tensions visible without pretending that one dashboard can resolve them. To build the analysis habit behind these decisions, تعلم تحليل حملات السوشيال ميديا helps readers learn how to analyze Meta ad campaign results after understanding core reporting metrics, including the relationship between digital advertising, social media marketing, and downstream outcomes.

What Meta Ads Reporting Actually Contains
Meta ads reporting is the structured presentation and interpretation of delivery, conversion, cost, audience, creative, and business outcome data from Meta campaigns. The reporting layer may use Ads Manager, an export, the Marketing API, a warehouse, or a connected analytics system. The tool is not the method. The method is the contract between a metric and the decision it is meant to support.
The Meta Marketing API’s Insights endpoint provides programmatic access to advertising insights that can be grouped and filtered for reporting workflows, as described in the official Meta Marketing API Insights documentation. That capability makes automation possible, but it does not make a report correct. A query can return precise values while the account uses the wrong date range, attribution setting, breakdown, or conversion definition.
Start with the decision, not the metric
A practical report assigns each signal to an owner and an action. The same number can be useful to one role and distracting to another. A creative strategist may need thumb-stop and landing-page behavior, while a finance owner needs spend pacing and recognized revenue. A sales leader may care about accepted opportunities rather than platform-reported leads.
- Delivery owner: watches spend, reach, frequency, impressions, and delivery status to identify underdelivery, instability, or audience saturation.
- Media buyer: evaluates cost, conversion volume, value, placement, audience, and creative patterns before changing budgets or targeting.
- Creative owner: compares hooks, formats, messages, and post-click behavior to decide what to brief next.
- Web or analytics owner: checks tracking continuity, event quality, landing-page behavior, and attribution consistency.
- Sales or revenue owner: reconciles leads, opportunities, purchases, pipeline, or revenue against the platform’s reported conversions.
- Executive owner: needs a compact view of investment, business outcome, risk, and the decision requiring approval.
Define every metric before displaying it
A metric definition should answer what is counted, when it is counted, where it comes from, which attribution rule applies, and what action it can influence. “Leads” might mean a completed instant form, a website event, a deduplicated CRM record, or a sales-qualified opportunity. Those are different populations, even if a dashboard places them in neighboring columns.
Write definitions in a data dictionary that travels with the report:
- Source: Meta, website analytics, CRM, payment system, or an approved blended model.
- Time basis: event date, click date, impression date, or reporting date.
- Attribution rule: the selected platform setting or the organization’s agreed business rule.
- Grain: account, campaign, ad set, ad, audience, placement, creative, or conversion record.
- Exclusions: tests, internal traffic, duplicate leads, refunds, cancelled orders, or other known removals.
- Owner: the person responsible for explaining movement and approving a response.
Do not silently combine platform-reported conversions with CRM outcomes. Present them as separate measures and explain the bridge. A platform metric can answer whether Meta is crediting conversions under its reporting rules; a CRM metric can answer whether those conversions became commercially useful. Both can be valid without being interchangeable.
Why Reporting Should Change Decisions
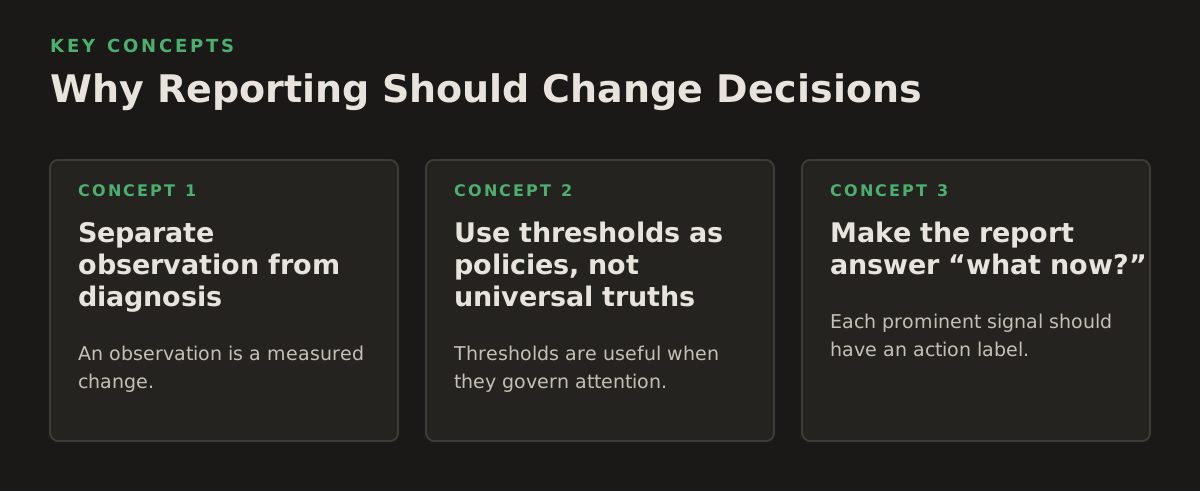
The purpose of Meta ads reporting is not to make performance look legible. It is to reduce avoidable decision errors: pausing a useful campaign because data is incomplete, scaling an inefficient ad because blended averages hide it, or rewriting creative when the real problem is a broken event.
Separate observation from diagnosis
An observation is a measured change. A diagnosis is a supported explanation. “Cost per lead increased” is an observation. “The audience is fatigued” is only one possible diagnosis; other explanations include an altered conversion event, a landing-page failure, delayed CRM ingestion, auction pressure, or a reporting-window mismatch.
A useful report shows the evidence chain:
- Signal: identify the movement and its comparison period.
- Scope: locate whether it affects the account, campaign, ad set, placement, creative, or conversion path.
- Integrity check: verify spend, delivery, event volume, timestamps, and tracking before interpreting efficiency.
- Hypothesis: state the most plausible cause and what would disprove it.
- Action: recommend a reversible change, an investigation, or no change.
- Follow-up: assign an owner and a time to review the result.
That structure protects teams from metric theater. A dashboard can display a falling click-through rate, but the right action might be to review the offer, the ad-to-landing-page message match, or the placement mix rather than immediately replacing the creative.
Use thresholds as policies, not universal truths
Thresholds are useful when they govern attention. They become harmful when they masquerade as industry benchmarks. A lead-generation account with a long sales cycle should not use the same trigger as a high-volume ecommerce account, and a small sample can create an impressive-looking percentage change with little decision value.
Illustrative starting policy: a team might flag a delivery or tracking anomaly when spend is occurring but the expected conversion event is absent for a defined review window; it might request human approval before a budget change greater than ten percent; and it might wait for a stable volume of conversions before treating a cost movement as a scaling signal. These are workflow examples, not universal performance thresholds. Set them using account history, conversion lag, financial tolerance, and the reversibility of the proposed action.
Thresholds should also include a confidence condition. “Cost is above target” is not sufficient if the comparison uses different attribution windows, incomplete data, or a period with no meaningful conversion volume. Pair the threshold with checks for sample size, freshness, tracking health, and materiality.
Make the report answer “what now?”
Each prominent signal should have an action label. Examples include:
- Investigate: use when the data may be wrong or incomplete.
- Monitor: use when the movement is real but not yet actionable.
- Test: use when a controlled change can distinguish competing explanations.
- Reallocate: use when evidence supports moving investment within an approved constraint.
- Escalate: use when the change affects budget, brand risk, compliance, or revenue guidance.
- Hold: use when the proposed change is not justified by the available evidence.
For marketers learning to move from metrics to campaign analysis, the important habit is to document why a signal triggered its action. This creates an audit trail for future reviews and teaches an AI assistant or automation system what “good judgment” means in the account.
How a Reliable Reporting System Works
A reporting system has a flow: collect data, normalize it, test its integrity, present it at the right grain, and route the decision to an owner. Most failures occur between those steps rather than inside the chart itself.
Control freshness and latency
Freshness means how recently the source data was updated. Latency means how long it takes for an event or outcome to become visible in the report. These are different. A dashboard may refresh frequently while conversions remain delayed by browser behavior, server processing, CRM imports, or attribution processing.
Show freshness beside the metric, not in a hidden technical panel. A practitioner should be able to see:
- the latest successful source refresh;
- the latest event timestamp received;
- the expected delay for website, platform, and CRM data;
- the period still considered provisional;
- the condition that marks a period as final or reconciled.
Use labels such as provisional, delayed, reconciled, and stale instead of implying that all cells have equal reliability. When a report shows a sudden conversion collapse, freshness status should be the first diagnostic, not an afterthought.
Normalize dimensions and preserve grain
Reporting becomes misleading when data sources use similar names for different objects. A campaign name may change while its ID remains stable. A creative can appear in multiple ad sets. A CRM lead may be associated with a campaign through one touchpoint while Meta attributes the conversion under another rule.
Keep stable identifiers alongside human-readable names. Preserve the original source grain before aggregating. A robust pipeline can roll data up for executive views while still allowing a user to return to the ad, event, or CRM record that produced the value.
When joining sources, document the join key and the risk:
- Campaign identity: source ID is safer than a mutable campaign name.
- Time zone: platform day boundaries may differ from warehouse or CRM day boundaries.
- Currency: cost and revenue must be comparable before return calculations.
- Conversion identity: deduplication rules must be explicit.
- Attribution: platform credit and business reporting credit may diverge.
Use drill-down paths instead of overloaded dashboards
A summary view should help an owner decide where to look next. It should not expose every breakdown at once. A practical drill-down begins with business outcome and spend, then moves through delivery, audience or placement, creative, landing page, and conversion quality.
For example, a weak cost per qualified opportunity can be investigated in this order:
- Confirm that spend and qualified-opportunity data are fresh and comparable.
- Compare platform leads with deduplicated CRM leads.
- Separate campaigns by objective, market, funnel stage, and offer.
- Inspect ad set and placement differences.
- Compare creative message, format, frequency, click quality, and post-click behavior.
- Check whether the sales process or qualification rule changed.
Do not drill down simply because the interface offers a breakdown. Every breakdown should be tied to a hypothesis. If the question is whether a creative attracts low-intent clicks, placement and post-click quality may be more useful than another demographic cut.
Build with APIs carefully
The official Google Ads API reporting overview describes query-based access to Google Ads reporting resources. A cross-channel system can use analogous extraction patterns for Meta and Google, but the fields, attribution semantics, naming conventions, and availability rules are not interchangeable. A shared dashboard schema should normalize concepts without erasing source-specific meaning.
For an MCP-based workflow, the safest pattern is to expose read operations first, attach source and freshness metadata to every result, and require approval for actions that alter campaigns. A recommendation should include the evidence used, the scope of the proposed change, the expected risk, and a reversal method. A tool that can edit an ad account without this context is automation without governance.
Where Meta Ads Reporting Breaks
Reporting failures are often organizational rather than mathematical. Teams argue over performance because they are looking at different windows, definitions, or levels of the funnel. The fix is not always a more advanced visualization; sometimes it is a written decision contract.
Common anti-patterns
- The KPI wall: dozens of metrics appear without an owner, threshold, or action.
- The blended-average trap: account-level efficiency hides a failing campaign and a productive campaign moving in opposite directions.
- The last-touch assumption: platform-reported conversions are treated as the complete causal story.
- The freshness blind spot: current-looking charts conceal delayed events or failed data loads.
- The permanent provisional state: teams never mark data as reconciled, so no one knows which version to trust.
- The breakdown lottery: analysts slice by every available dimension until a random segment appears significant.
- The automation leap: a system changes budgets or ads before checking tracking, approvals, business constraints, and reversibility.
Another failure is optimizing the report for the platform rather than the business. Meta can report delivery efficiently while the organization loses margin, receives poor-fit leads, or overloads sales capacity. Include the business outcome where it is available, but preserve the platform view so the team can distinguish media delivery from downstream performance.
Resolve attribution disagreements explicitly
Attribution is a reporting rule, not a natural law. Platform reporting may assign credit under a selected click or view framework, while analytics and CRM systems use different sessions, windows, identity rules, or revenue dates. Google’s documentation on data-driven attribution in Analytics illustrates why attribution models can distribute credit according to model logic rather than a simple single-touch rule.
Do not force all systems into one number. Show a reconciliation view with:
- platform-reported conversions;
- analytics-recorded key events;
- deduplicated CRM outcomes;
- accepted opportunities or purchases;
- revenue or margin, where finance has approved the definition;
- known reasons for the gaps.
Review the gap as a diagnostic signal. A widening difference may indicate tracking loss, consent behavior, duplicate events, changed qualification, conversion delay, or a real attribution disagreement. It should trigger investigation before budget reallocation.
Account for privacy and modeled data without overclaiming
Measurement can be incomplete because users decline tracking, identifiers are unavailable, browsers limit persistence, or events arrive through different technical paths. The correct response is to communicate uncertainty, not to invent precision. Mark modeled, estimated, delayed, or directly observed values distinctly, and avoid comparing them as if they were generated by identical processes.
For implementation teams, event design and diagnostics deserve their own ownership. A reporting dashboard should not be the only place where data quality is monitored. Keep a change log for event names, parameters, consent handling, landing-page forms, CRM mappings, and campaign objectives. Otherwise a metric movement can be mistaken for market performance when it is actually a schema change.
How Practitioners Apply the System
A useful operating model gives each role a view that is short enough to use and deep enough to act on. The views should share definitions and source data, but not necessarily the same layout.
A reusable role-based reporting template
| Owner | Primary question | Required signals | Typical action |
|---|---|---|---|
| Executive or budget owner | Is investment producing an acceptable business outcome? | Spend, approved outcome, revenue or pipeline, pacing, material risks | Approve, hold, reallocate, or request explanation |
| Media buyer | Where is delivery or efficiency changing? | Spend, conversions, cost, value, delivery status, audience, placement, creative | Diagnose, test, adjust within guardrails |
| Creative strategist | Which message and format deserve another iteration? | Reach, frequency, engagement quality, click quality, landing-page behavior, conversion quality | Brief, rotate, refine, or retire creative |
| Analytics owner | Can the reported movement be trusted? | Event counts, freshness, source parity, deduplication, attribution, error logs | Repair, annotate, reconcile, or certify data |
| Sales or revenue owner | Are leads becoming valuable outcomes? | Lead status, acceptance rate, opportunity rate, revenue, lag, cohort quality | Change qualification, routing, offer, or media feedback |
Keep the executive view decision-oriented and the operator view diagnostic. A senior owner should not need to inspect every ad to approve a budget move, while a buyer should not be forced to work from a single blended return figure.
Illustrative worked example
Illustrative example, not a benchmark: suppose a team sets a starting policy that a campaign is reviewed when its reported cost per lead rises above an internal target for two consecutive review periods, provided conversion volume is sufficient and data is fresh. The report shows the following hypothetical movement:
- Campaign North spends $1,200 and records 48 platform leads at a reported $25 cost per lead.
- Campaign South spends $1,200 and records 30 platform leads at a reported $40 cost per lead.
- After CRM deduplication, North produces 18 accepted leads and South produces 15 accepted leads.
- The resulting illustrative cost per accepted lead is about $67 for North and $80 for South.
The first conclusion should not be “pause South.” The report should confirm that both campaigns use the same lead definition, attribution setting, date boundary, and CRM matching rule. It should then inspect placement, audience, creative, and sales acceptance reasons. If South’s leads are accepted at a similar rate but close later, a premature pause could remove useful demand. If South’s low-quality leads come from one placement and the pattern persists after validation, a targeted test or controlled reallocation is more defensible than a wholesale campaign change.
The numbers above are deliberately an illustrative policy example. Replace them with account-specific economics: margin, sales capacity, payback tolerance, conversion lag, and the cost of making a wrong change.
Use approval gates for automated actions
Automation should separate analysis from execution. A useful recommendation record contains:
- Proposed change: the exact campaign, ad set, ad, budget, targeting, or status affected.
- Reason: the signal, comparison, and diagnostic evidence.
- Scope: what is included and explicitly excluded.
- Risk: spend exposure, delivery disruption, learning impact, or brand concern.
- Reversal: how to restore the prior state.
- Approval: the named owner and timestamp.
- Review: the next observation point and success or failure condition.
NotFair’s Meta Ads MCP is relevant when a team wants an AI client to inspect Meta campaign data and prepare controlled actions, while Google Ads MCP can support a similar approval-oriented workflow for Google Ads. The important design principle is not merely connecting a model to an account; it is making the model show its evidence and keep irreversible decisions behind human authorization.
Governance and ownership
Assign ownership before a report goes live. Otherwise every anomaly becomes an analyst’s problem, and no one is accountable for fixing the source or deciding whether the signal warrants action.
- The media owner owns campaign interpretation and approved optimization.
- The analytics owner owns definitions, data freshness, event health, and reconciliation.
- The CRM or sales owner owns downstream status, qualification, and revenue feedback.
- The finance owner approves revenue, margin, currency, and pacing definitions.
- The technical owner owns credentials, extraction jobs, schemas, logs, and access controls.
- The approver owns material budget, targeting, creative, and policy-sensitive changes.
Maintain a change log for report definitions and account changes. Record when an event changed, when an attribution setting changed, when a campaign objective changed, and when a pipeline failed. Annotated history prevents teams from interpreting a structural break as a sudden market insight.
Validate the reporting loop
A reporting system is working only if it changes decisions in a traceable way. Validate it through an operating loop:
- Log the initial signal: record what the report showed, when it was fresh, and who saw it.
- Record the decision: document whether the team investigated, tested, changed, escalated, or held.
- Capture the rationale: preserve the hypothesis and expected consequence.
- Review the outcome: compare the later data using the same definitions and note any lag.
- Classify the result: mark the action as supported, unsupported, inconclusive, or blocked by data quality.
- Improve the system: revise the definition, threshold, drill-down, owner, or approval rule if the process failed.
Useful validation questions include: Did the owner notice the signal in time? Did the dashboard point to the right diagnostic path? Was the recommended action reversible? Did the team make a different decision because of the report? Did the decision improve evidence quality even when performance did not improve? Those questions measure operational value rather than visual polish.
Build Meta Ads Reporting Around Reversible Decisions
The strongest reporting practice is to design backward from the decisions your team is willing to make. Start with business outcomes and owners, define platform and downstream metrics separately, display freshness and uncertainty, and give each signal a drill-down path. Use thresholds as explicitly labeled starting policies, then revise them when account economics and decision history provide better evidence.
For teams managing several channels or accounts, connect reporting to an approval-gated workflow rather than granting an AI system unrestricted write access. NotFair provides hosted MCP connections that let supported AI clients inspect advertising and analytics data, diagnose issues, recommend fixes, and execute reversible campaign changes subject to approval. NotFair is a sensible next step if you want reporting to lead to accountable action without losing human control.
Authored with NotFair SEO