

A google ads report is not a screenshot of campaign metrics or a weekly export sent to a shared inbox. It is a decision system: a defined set of data, comparisons, owners, thresholds, and next actions that helps a Google Ads team decide what to investigate, change, pause, or leave alone.
That distinction matters for agencies, in-house growth teams, and small businesses alike. A report can contain cost, clicks, conversions, and return on ad spend while still failing its job. If conversion data is delayed, the owner is unclear, the comparison is misleading, or no action follows a warning, the document is reporting activity rather than managing performance.
What a Google Ads Report actually is
A useful report connects five layers:
- Scope: which accounts, campaigns, conversion actions, devices, audiences, locations, and dates are included.
- Definitions: how metrics such as conversions, revenue, cost, and return on ad spend are calculated.
- Freshness: when the data was last collected, and which fields may still be incomplete.
- Decision rules: what counts as normal, concerning, or urgent for this account.
- Ownership: who investigates the signal, who approves a change, and who records the outcome.
For example, “ROAS is 2.4” is an observation. “Non-brand search ROAS fell from the trailing 28-day baseline by more than 20%, after allowing for conversion lag; the paid search manager will inspect search terms and budget allocation before the next business day” is a reporting control.
Google Ads defines and displays many metrics through its own reporting surfaces, while the Google Ads API exposes resources and fields for programmatic reporting. The API documentation is useful when building a repeatable data pipeline because it explains the reporting model, query structure, and available resources rather than treating the interface as a static spreadsheet. See Google’s Google Ads API reporting overview for the underlying approach.
The unit of analysis changes the meaning
A report should state whether a number is account-level, campaign-level, ad-group-level, keyword-level, asset-level, or conversion-action-level. Aggregation hides the mechanism that produced the result.
An account may show acceptable efficiency while a high-spend campaign is deteriorating and a low-spend brand campaign is masking it. Likewise, a campaign can look weak because of one location, device type, landing page, or search theme. The first design question is therefore not “Which KPIs should be included?” It is “Which decision does each view support?”
Do not mix unlike scopes. A blended account ROAS is not a substitute for non-brand efficiency, brand protection, prospecting economics, or lead quality. If the business uses different targets for those jobs, the report needs separate rows and separate decisions.
Why the report matters: it turns measurement into operating decisions
Paid search generates more signals than most teams can review manually. The practical value of a report is its ability to reduce that signal set to a manageable queue of decisions without pretending that every fluctuation is meaningful.
Organize metrics by decision and owner
The following structure is more useful than a flat KPI list. Thresholds are illustrative starting policies, not universal benchmarks; each account should replace them with its own economics, volume, and data latency.
| Decision | Primary owner | Signals | Illustrative starting policy | Triggered action |
|---|---|---|---|---|
| Can we spend the approved budget? | Growth lead or budget owner | Spend, pacing, impression share, marginal CPA or ROAS | Investigate when month-to-date pacing is more than 10% away from plan | Check budget limits, demand, bids, eligibility, and tracking before reallocating |
| Are campaigns attracting the right demand? | Paid search manager | Search terms, match behavior, CTR, query themes, negatives | Review when a new query cluster consumes meaningful spend without a qualified outcome | Add negatives, refine intent grouping, or create a controlled test |
| Is traffic converting? | Acquisition manager | Conversion rate, cost per conversion, landing-page path, device, location | Escalate when conversion rate is 20% below its comparable baseline after lag has elapsed | Validate tracking, segment the loss, then fix the highest-impact step |
| Are conversions economically valuable? | Revenue or demand-generation owner | Conversion value, qualified leads, pipeline, revenue, ROAS | Review when value per conversion or qualified-lead rate moves below the approved floor | Reconcile CRM outcomes and adjust bidding, targeting, or lead qualification |
| Is the account technically healthy? | Account operator or automation owner | Disapprovals, spend anomalies, tracking status, data freshness, policy alerts | Urgent review for zero spend, broken conversion flow, or stale data beyond the agreed window | Fix access, tags, feeds, approvals, or pipeline failures before optimization |
This ownership model prevents the common failure where every stakeholder sees the same dashboard but assumes someone else is responsible for the response. One signal should have one accountable next step. Consulted people can be listed separately, but “the team” is not an owner.
Separate leading, lagging, and diagnostic signals
Clicks, impressions, search terms, and landing-page engagement can provide early clues. Conversions, qualified opportunities, revenue, and profit are usually closer to the business outcome but may arrive later. Diagnostics explain the movement rather than proving its cause.
- Leading signal: impression share drops after a budget cap changes; inspect eligibility and pacing before declaring demand loss.
- Lagging signal: qualified pipeline declines; connect the period back to the campaigns and lead cohorts that generated it.
- Diagnostic signal: mobile conversion rate falls while desktop remains stable; inspect page speed, form behavior, and device-specific traffic.
- Guardrail: spend or cost rises without a corresponding increase in approved outcomes; pause expansion until data quality and economics are clear.
A report should not treat a leading signal as a final business result. The right design shows the relationship between them and labels the confidence of the interpretation.
How to build the measurement layer
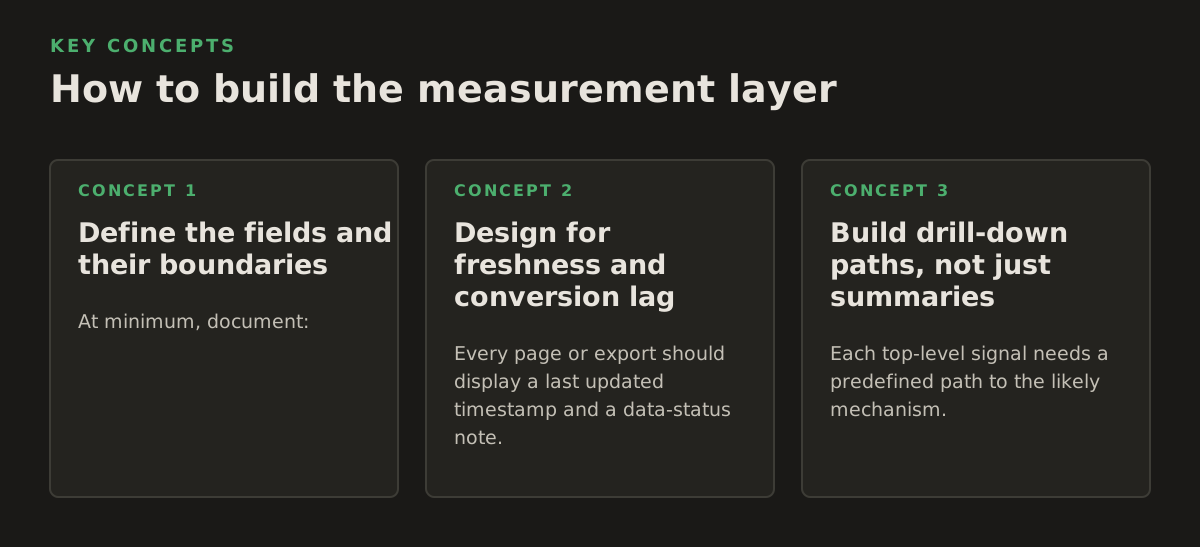
Start with a measurement contract before choosing a dashboard tool. The contract is a short, maintained specification that makes the report reproducible when account structure, tracking, or personnel changes.
Define the fields and their boundaries
At minimum, document:
- The reporting timezone and currency.
- The attribution or conversion-counting approach used for each decision.
- Which conversion actions are primary, secondary, imported, or excluded.
- Whether “conversions” means all recorded actions, unique actions, qualified leads, purchases, or another business outcome.
- Whether cost includes only media spend or also agency fees, taxes, and other operating costs.
- Whether revenue is gross, net, booked, recognized, or modeled.
- The comparison period: previous period, same weekday pattern, year-over-year, forecast, or trailing baseline.
Google’s documentation distinguishes conversion-related reporting concepts and attribution settings, so a report should not silently combine platform conversions with CRM outcomes as if they were identical. Review the official Google Ads conversion attribution documentation when deciding how conversion credit is assigned and communicated.
For an ecommerce account, “value” might mean transaction revenue imported from the store. For a B2B account, the useful hierarchy may be form submission, accepted lead, sales-qualified opportunity, and closed revenue. A lead-generation report that optimizes only to form fills can reward cheap but unqualified submissions. The report should expose that gap rather than conceal it inside a blended CPA.
Design for freshness and conversion lag
Every page or export should display a last updated timestamp and a data-status note. Freshness is not a cosmetic detail. A decision-maker needs to know whether the report represents yesterday’s spend, a partial current day, or a period whose conversions are still arriving.
Use separate labels for:
- Collection freshness: when the source data was retrieved.
- Completeness: whether the reporting period is closed or still partial.
- Conversion maturity: how long outcomes usually take to appear.
- Pipeline health: whether the import, API query, or transformation succeeded.
Google Analytics documentation describes data freshness and processing delays, which is a useful reminder that a recent date range may not mean a complete date range. See the official Google Analytics data freshness guidance when coordinating Analytics-based views with advertising data.
Consider an illustrative policy for a lead account with a typical several-day sales process: use the latest two days for delivery and spend monitoring, use a seven-day-old cohort for early conversion review, and use a 28-day-old cohort for qualified-lead analysis. Those intervals are examples, not benchmarks. The correct windows depend on the account’s actual lag distribution.
Do not compare an incomplete current week with a fully matured prior week and call the difference performance. Mark partial periods visibly, or exclude them from outcome comparisons while retaining them for operational alerts.
Build drill-down paths, not just summaries
Each top-level signal needs a predefined path to the likely mechanism. A falling account conversion rate might lead through campaign, network, device, location, landing page, search term, and conversion action. Without that path, analysts waste time exporting every available dimension.
- Confirm that the metric and data pipeline are valid.
- Compare the affected period with a relevant baseline.
- Locate the smallest material segment contributing to the change.
- Check whether volume, mix, tracking, or auction conditions explain the movement.
- Choose a reversible action and define the evidence that will confirm or reject it.
Drill down by contribution, not curiosity. A segment that changed by 80% but represents 1% of spend may deserve less attention than a segment that changed by 12% and represents 60% of spend.
Where Google Ads Reporting breaks
Most reporting failures are not caused by a missing chart. They come from false confidence: the report appears precise while the underlying comparison, attribution, or data state is wrong.
Dashboard anti-patterns
- The KPI wall: dozens of cards show numbers but no owner, threshold, or action.
- The blended average: brand, non-brand, shopping, remarketing, and prospecting are combined despite different objectives.
- The fresh-data illusion: a current-day chart is presented next to mature outcome data without a completeness warning.
- The percentage trap: a conversion rate rises from 1% to 2% on a tiny sample and is treated as a stable improvement.
- The attribution mismatch: Google Ads conversions, Analytics conversions, and CRM outcomes are placed in one table with no definitions.
- The automated-action leap: a threshold immediately changes bids or budgets without validation, approval, or a rollback plan.
- The export cemetery: recurring CSV files are generated but no one records which decision they changed.
Another failure is confusing auction symptoms with account causes. Impression share can decline because of budget, rank, eligibility, targeting, or demand. A report that jumps from “impression share down” to “raise bids” is not diagnosing; it is prescribing from one symptom.
Account for statistical and operational uncertainty
Short windows are noisy. A single conversion can materially change CPA on a low-volume ad group. Seasonality, promotions, day-of-week mix, budget changes, tracking outages, and policy restrictions can all create movement that looks like optimization opportunity.
Use a hierarchy of confidence:
- High confidence: a broken tag, disapproved campaign, zero spend against an approved plan, or a confirmed billing or access issue.
- Medium confidence: a sustained movement across enough volume with a plausible segment-level explanation.
- Low confidence: a short-term change in a small segment or a movement during an immature conversion window.
The action should match the confidence. High-confidence technical failures can prompt immediate remediation. Medium-confidence performance changes may justify a controlled, reversible adjustment. Low-confidence signals usually deserve observation or a narrower diagnostic rather than a broad budget shift.
Thresholds should also reflect economic asymmetry. If wasting budget is more damaging than missing incremental volume, use tighter overspend alerts and slower expansion. If inventory is limited and growth is the priority, the report may emphasize lost opportunity and impression coverage. A threshold is a policy choice, not a law of nature.
How practitioners apply the report each week
A strong operating rhythm uses different views for different jobs. The executive view should not force an account operator to search through strategic summaries for a disapproved ad, and the operator view should not overwhelm a budget owner with every search term.
A reusable role-based template
| View | Audience | Include | Exclude or de-emphasize | Review cadence |
|---|---|---|---|---|
| Business outcome | Owner, finance, growth lead | Spend, approved outcomes, qualified pipeline or revenue, forecast, variance, risks | Granular ad and keyword noise | Weekly or monthly, depending on spend cycle |
| Optimization queue | Paid search manager or agency strategist | Material changes, query themes, budget constraints, bid signals, landing-page segments, tests | Metrics without a proposed decision | Several times per week |
| Technical health | Account operator, analyst, automation owner | Freshness, spend anomalies, conversion status, disapprovals, feed and import errors, permissions | Long-term trend commentary | Daily or on alert |
| Experiment record | Strategist, approver, analyst | Hypothesis, change, affected scope, start date, guardrails, result, next decision | Unattributed “improvements” | At start, checkpoint, and close |
For a concrete example, imagine a campaign with a starting policy of a $100 daily budget, a target cost per qualified lead of $80, and a seven-day conversion lag. The report should not automatically cut budget because yesterday’s CPA is $140. Instead, it might show:
- $100 planned spend versus $96 actual spend: pacing is within the illustrative 10% review band.
- 18 recorded conversions, but only 11 are mature enough for the qualified-lead view.
- Mobile qualified-lead rate down 25% versus the mature 28-day baseline.
- One landing page responsible for 70% of mobile traffic and most of the decline.
- Action: validate the mobile form and analytics event first; do not change bids until tracking and page behavior are confirmed.
The report has done its job even before a campaign setting changes. It has converted a broad efficiency concern into a prioritized investigation with a defensible next step.
Use reversible actions and approval gates
Automation is most useful when it shortens diagnosis and execution without removing judgment from high-impact decisions. For example, an AI workflow connected through a Google Ads MCP could retrieve campaign performance, group anomalies by likely cause, draft a change, and wait for approval before applying it.
That workflow should carry context with every proposed action:
- The exact entity and setting to change.
- The current value and proposed value.
- The signal and comparison that justified the proposal.
- The expected benefit and possible downside.
- The approval owner and expiration time.
- The rollback instruction and post-change monitoring window.
Apply the same principle across channels. A cross-channel view can pair Google Ads with a Meta Ads MCP, but the report should preserve each platform’s definitions and attribution context. A blended “paid social plus paid search ROAS” may be useful for budget planning, while remaining inappropriate for deciding whether to add a negative keyword or change a search bid.
Governance, validation, and the decision loop
Reporting becomes durable when governance is explicit. Otherwise, definitions drift, automated actions accumulate, and new team members cannot tell why a threshold exists.
Assign ownership beyond the dashboard
Create a small register for every material metric and action:
- Metric owner: accountable for the definition and business meaning.
- Data owner: accountable for collection, transformation, freshness, and access.
- Decision owner: authorized to approve a budget, targeting, bidding, or tracking change.
- Reviewer: checks unusual actions, exceptions, and post-change outcomes.
- Change log: records what changed, why, when, by whom, and how it can be reversed.
Review the metric contract whenever conversion actions change, a CRM field is renamed, a new campaign objective is introduced, or the organization changes its definition of a qualified lead. Version the definitions rather than silently rewriting historical interpretation.
Validate whether reporting changes decisions
A dashboard is not validated because it loads successfully. Validate the full loop from signal to decision to outcome.
- Record the baseline decision process: how often the team reviews the account, what alerts it receives, and which changes are normally made.
- Introduce the report with explicit owners, thresholds, and action fields.
- Log every triggered signal, including signals that were rejected as false positives.
- Review whether the resulting action matched the recommended path and whether approval or rollback was needed.
- After the relevant maturation window, compare the outcome with the stated hypothesis, not merely with the day before the change.
- Retire, tighten, or expand rules based on false positives, missed issues, and decision quality.
Useful validation questions include:
- Did the report cause a different decision from the one the team would have made without it?
- Did the owner act within the intended freshness window?
- Were alerts dominated by noise, or did they identify material issues?
- Can an analyst explain the metric from source to final number?
- Can every automated change be reversed and attributed?
- Did the system improve the quality of decisions, or only increase the number of reports produced?
Google Ads API reporting can support scheduled retrieval and structured analysis, but a data connection alone does not create governance. The implementation still needs query versioning, error handling, access controls appropriate to the organization, and a human-readable record of decisions. Google’s API call-structure documentation is a useful reference for understanding how requests and responses fit into an application rather than treating an API pull as an unexplained black box.
For teams building AI-assisted workflows, use an approval gate for material budget, targeting, bidding, and conversion-setting changes. Let the system perform low-risk retrieval, classification, and draft generation automatically, while requiring an accountable person to approve actions whose downside is difficult to contain.
Build the report around decisions first. Start with the owners, business outcomes, data maturity, and reversible actions; then add only the metrics that help those people choose the next move. If your current dashboard cannot state who acts on a warning, when the data is trustworthy, and how success will be checked afterward, redesign that workflow before adding more charts. NotFair can help connect approval-gated AI workflows to advertising and analytics systems through NotFair, so reporting can lead to controlled action rather than another unattended export.
Authored with NotFair SEO