

A google ads dashboard should do more than display clicks, impressions, and spend. It should tell a campaign owner what changed, whether the change is trustworthy, which account or query caused it, and what decision is safe to make next. For agencies, in-house growth teams, and small businesses, that means turning advertising data into an operating system for budget control, diagnosis, and approved execution.
What a Google Ads Dashboard Actually Is
A Google Ads dashboard is a decision interface built on campaign data. It combines selected dimensions, metrics, time comparisons, alerts, and drill-down paths so a particular person can answer a particular business question. A reporting screen can show numbers; a useful dashboard explains what those numbers require someone to do.
The distinction matters because Google Ads contains many valid views of the same account. Campaign-level cost can support a budget decision. Search-term data can support a query-quality decision. Conversion lag can explain why yesterday’s cost per acquisition looks unusually high. None of those views is automatically the “right” dashboard. The right design depends on decision, owner, time horizon, and acceptable risk.
Google describes its reporting system as a way to retrieve performance data by selecting resources, fields, segments, and metrics; the available combinations determine the grain and meaning of a report. Its Google Ads API reporting overview is a useful primary reference for understanding that structure: Google Ads API reporting documentation. In practice, a dashboard should preserve that grain instead of mixing campaign, ad-group, search-term, and conversion rows into one misleading total.
The four layers of a useful dashboard
- Executive layer: spend, conversion value, efficiency, pacing, and material account risks.
- Operator layer: campaign delivery, budget constraints, bidding signals, query quality, and creative coverage.
- Analyst layer: segmented trends, attribution differences, conversion lag, auction context, and diagnostic evidence.
- Action layer: recommended changes, approval status, owner, expected effect, and rollback details.
These layers should not necessarily be four separate tools. They can be tabs, filtered views, or linked reports. The design requirement is that each layer answers a different question without forcing an executive to interpret search-term rows or an operator to rely on a blended account average.
A practical definition is therefore: a dashboard is a monitored decision workflow with a visual front end. It has inputs, interpretation rules, owners, thresholds, and actions. If removing the charts would not change any decision, the dashboard is probably a status report rather than an operating system.
Why the Dashboard Matters: Metrics Must Serve Decisions
The most common dashboard mistake is organizing by metric category: traffic, conversions, cost, and engagement. That arrangement looks tidy but leaves ownership ambiguous. Organize by the decision being made instead. A finance owner needs to know whether spend is controlled. A search manager needs to know whether intent and bidding are healthy. A client lead needs to know whether performance movement is real enough to explain.
| Decision and owner | Primary signals | Illustrative starting policy | Action triggered |
|---|---|---|---|
| Should budget change? Owned by growth lead or media buyer | Spend pace, conversion value, marginal CPA or ROAS, impression share lost to budget | Review when weekly spend pace is more than 10% from plan; do not scale on one day of data | Shift budget, hold spend, or investigate delivery before editing bids |
| Is tracking credible? Owned by analytics or measurement lead | Conversion volume, tag status, revenue continuity, offline import timing | Escalate when primary conversions fall 30% versus a comparable weekday after checking lag | Validate tags, consent flow, imports, and CRM joins before optimizing |
| Is traffic commercially relevant? Owned by search manager | Search terms, match behavior, lead quality, negative-keyword themes | Review new query themes weekly or sooner for high-spend campaigns | Add negatives, refine match strategy, restructure intent, or change landing-page alignment |
| Is bidding learning safely? Owned by account operator | Strategy status, bid distribution, conversion volume, target variance, major changes | Flag large target or budget changes for approval; compare against a stable baseline | Hold, annotate, reduce volatility, or approve a controlled change |
| Can the client or executive be updated? Owned by account strategist | Business outcome, explanation of variance, risks, next action | Publish a weekly narrative only after data freshness and attribution checks | Send an evidence-backed update with a named owner and date |
The thresholds above are illustrative starting policies, not universal benchmarks. A local service advertiser with ten monthly leads should not use the same alert sensitivity as an ecommerce account with thousands of purchases. Thresholds should reflect conversion volume, spend concentration, sales-cycle length, and the cost of a false alarm.
Freshness is part of the metric
A value without a timestamp is incomplete. Put the data extraction time, reporting date range, source, and expected lag beside every important view. Google Ads reporting can include conversion data that changes after the interaction date as conversions are recorded or attributed. Google’s documentation on conversion data and reporting should be the authority for the specific conversion setup rather than an assumed “yesterday is final” rule: Google Ads conversion measurement documentation.
Use distinct labels such as provisional, partially mature, and final enough for this decision. For example, a daily pacing panel may be actionable today, while a CPA panel for a long-consideration B2B lead may require several days of lag. The dashboard should not hide this uncertainty with a green status badge.
Definitions prevent false arguments
Write a metric dictionary into the dashboard or its linked documentation. “Conversions” might mean all conversions, primary conversions, imported qualified leads, or a platform-specific count. “ROAS” may use reported conversion value, gross revenue, or contribution margin. “Spend” may be platform cost, invoiced media cost, or a finance-adjusted amount.
- Name the source and reporting object.
- State the date basis: click date, conversion date, impression date, or invoice period.
- Specify filters, attribution model, currency, and timezone.
- Record whether the value is estimated, delayed, or reconciled.
- Assign an owner who can approve definition changes.
Google’s official explanation of Google Ads metrics is useful when documenting terms such as impressions, clicks, conversions, and conversion rate: Google Ads metrics and reporting guidance. The practical lesson is not to copy a definition blindly; it is to ensure the dashboard’s label matches the platform’s meaning and the business’s decision.
How to Build the Measurement System
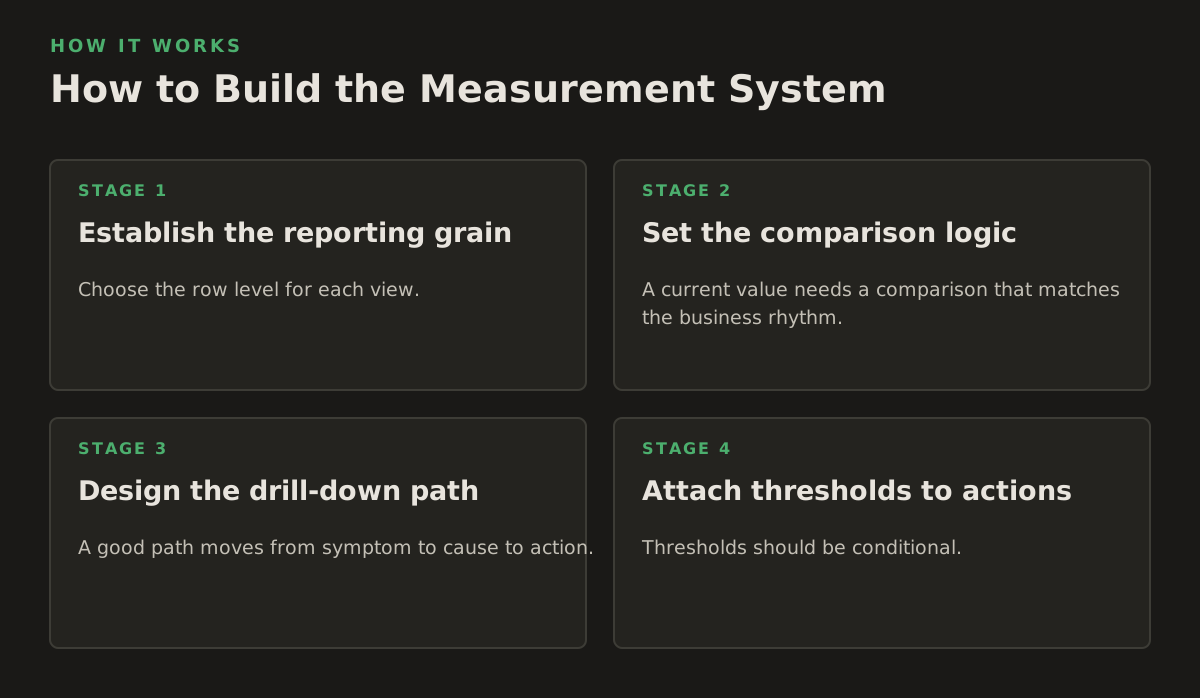
Start with the action, then work backward to the minimum evidence needed. A dashboard that contains every available field becomes slow to load and difficult to govern. A dashboard that contains only headline KPIs cannot diagnose anything. The useful middle is a small decision surface connected to progressively deeper evidence.
1. Establish the reporting grain
Choose the row level for each view. Campaign-day data is appropriate for pacing and budget movement. Campaign-device-day may reveal a mobile tracking issue. Search-term rows are appropriate for query intent but cannot be safely summed with campaign rows. Conversion-action data may explain why totals differ between platform and CRM.
Keep separate tables or queries for separate grains, then join only on dimensions that preserve meaning. Never sum segmented rows as if they were independent totals when one conversion can appear in multiple segment views. Label each chart with its grain, particularly if users can switch between campaign, ad group, asset, device, location, and audience.
2. Set the comparison logic
A current value needs a comparison that matches the business rhythm. Use prior comparable weekdays for daily operations, a preceding period for pacing, and year-over-year comparisons for seasonal demand when the account has enough history. Avoid treating an arbitrary seven-day comparison as inherently meaningful for a business with weekend-heavy demand.
Every variance view should answer three questions:
- What changed in absolute terms?
- Is the change large relative to normal volatility and data maturity?
- Which dimension explains the largest share of the change?
For example, a 20% CPA increase may be caused by a 5% conversion-rate decline across the account, or by one campaign responsible for most of the incremental spend. Those cases deserve different actions. Add contribution-to-change columns so users can rank causes rather than guess from a line chart.
3. Design the drill-down path
A good path moves from symptom to cause to action. One practical sequence is account summary, campaign variance, ad-group or asset breakdown, search terms or audience segments, then landing page and CRM quality. The user should be able to retain the same date range and comparison while moving deeper.
Include filters for campaign type, brand versus non-brand, geography, device, network, and conversion action where those dimensions are operationally relevant. Do not expose every possible filter by default. Drill-downs should narrow uncertainty, not create more browsing.
4. Attach thresholds to actions
Thresholds should be conditional. A warning might require both a relative change and a minimum absolute volume. “CPA up 25%” is weak if it represents one conversion and $40 of spend. A more defensible starting policy could be: review when CPA is at least 25% above the approved target and the period contains at least ten primary conversions, or when spend exceeds a defined risk amount without a primary conversion. These are examples to adapt, not claims about a universal standard.
Use three levels:
- Inform: a movement worth watching, with no immediate edit.
- Review: an owner must inspect evidence by a defined time.
- Block or escalate: a high-risk issue prevents automated action or requires approval.
Thresholds also need hysteresis: a condition should not flip between green and red every refresh. Require the metric to return below a lower recovery threshold, or remain abnormal for a specified number of comparable periods. This reduces alert fatigue and makes status changes interpretable.
5. Treat annotations as data
Record budget edits, target changes, tracking releases, landing-page launches, promotions, feed incidents, and agency handoffs. Annotations allow a reviewer to distinguish a performance response from a planned intervention. Without them, the dashboard may incorrectly label a deliberate budget increase as unexplained deterioration.
For teams using multiple platforms, keep a shared change log but preserve source-specific definitions. A Google Ads MCP can help an approved workflow connect an AI client to Google Ads data and actions, while a Meta Ads MCP serves the corresponding Meta Ads workflow. The dashboard remains the measurement layer; the connection does not replace metric governance.
Where Google Ads Dashboards Break
Dashboards fail less often because of a missing chart than because of a broken contract between data and action. Before adding another visualization, inspect the following failure modes.
Latency mistaken for deterioration
Lead-generation accounts often have a delay between click, form validation, CRM acceptance, and revenue qualification. Ecommerce data can also be revised by refunds, cancellations, or late events. A daily chart that treats immature conversion dates as final will encourage unnecessary bid and budget changes.
Show a maturity indicator and a backfill expectation. If the dashboard cannot quantify lag, use language such as “early signal” rather than “performance.” A mature reporting view may need to compare older cohorts, while a pacing view can use spend and clicks today without pretending that today’s CPA is settled.
Attribution and business outcomes diverge
Platform-reported conversions answer a measurement question, not always the sales team’s question. A campaign can appear efficient on form submissions while producing poor lead quality. Conversely, a long sales cycle can make a good campaign look weak before offline outcomes arrive.
Connect platform events to business stages where possible, and place the mapping in the metric dictionary. Keep reported conversions, qualified leads, opportunities, and revenue as separate stages. Do not replace a measurement problem with a blended score that hides where the funnel is leaking.
Blended totals conceal concentration
An account average can remain stable while one campaign consumes the budget and another collapses. Always pair totals with concentration views: share of spend by campaign, share of conversions by campaign, and the top contributors to variance. A small number of high-spend entities should receive a review path even when the account-level line is green.
Alert overload trains people to ignore the system
Alerts should be scarce, explainable, and actionable. A warning that says “CTR changed” is not enough. State the comparison, affected entity, data freshness, likely diagnostic path, and owner. Suppress duplicate alerts across email, chat, and the dashboard unless each channel has a different job.
- Do not alert on every metric movement.
- Do not alert before checking data freshness or known maintenance windows.
- Do not trigger an automated edit from a single weak signal.
- Do not allow an alert to remain ownerless.
- Do not close an alert without recording the decision or reason for dismissal.
Automation changes the account without a safety boundary
Recommendations and execution are separate permissions. A system may identify a likely waste pattern without being authorized to add negatives, pause a campaign, change a target, or move budget. Approval gates should reflect reversibility and blast radius.
Low-risk examples may include creating a draft recommendation or grouping search terms for review. Higher-risk actions include changing a shared budget, pausing a high-volume campaign, editing conversion settings, or applying a broad negative keyword. Require a named approver, a before-state snapshot, a reason, and a rollback instruction. This is especially important when an AI client is involved: the model can accelerate diagnosis, but policy decides execution.
A Reusable Role-Based Dashboard Template
Use the following as a starting architecture for an agency, an in-house team, or a small business. It is intentionally role-based rather than platform-menu-based.
Owner view: budget and business control
The owner view should fit on one screen and answer whether the account is spending according to plan and producing the intended business result. Include:
- Month-to-date spend versus plan, with projected finish and pacing freshness.
- Primary business outcome, such as qualified leads or contribution revenue.
- Efficiency against the approved target, clearly labeled by attribution and maturity.
- Largest positive and negative contributors to variance.
- Open risks: tracking, budget constraint, disapproved assets, feed issue, or unexplained shift.
- Next decision, owner, approval state, and due date.
This view should not contain every campaign. Its job is escalation and prioritization. A useful narrative might say: “Spend is 8% behind plan, driven by a limited non-brand campaign; lead volume is immature through March 24, 2026; review search demand and budget eligibility before increasing bids.” That is more useful than a red arrow beside CPA.
Operator view: delivery and intervention
The media buyer or account operator needs a sortable work queue. Include campaign status, daily budget, spend pace, impression share loss, bid-strategy state, conversions, cost per primary conversion, and recent changes. Add links to search terms, ads, assets, and landing pages.
Prioritize by potential consequence rather than by the largest percentage movement. A campaign spending $2,000 per day with a 15% efficiency decline may deserve attention before a small campaign with a 60% decline. Use absolute impact, confidence, and reversibility as ranking fields.
Analyst view: diagnosis and explanation
The analyst view should preserve raw evidence and allow controlled segmentation. Include comparison periods, conversion lag, device, geography, network, audience, search term, query category, landing page, and CRM stage. Document exclusions and deduplication logic.
Analysts also need a reconciliation panel: platform spend versus finance spend where applicable, platform conversions versus analytics events, and primary conversions versus qualified outcomes. A mismatch is not automatically an error, but an unexplained mismatch should prevent confident recommendations.
Governance view: trust and change control
Governance is not an administrative appendix. It determines whether users can act safely on the dashboard. Track:
- Data source, extraction timestamp, timezone, and refresh status.
- Metric-definition version and the person responsible for it.
- Access roles for viewing, recommending, approving, and executing.
- Open data-quality incidents and their business impact.
- Change history for queries, filters, thresholds, and automated actions.
- Retention of before-and-after values for reversible edits.
Assign one accountable owner per decision class. The analytics owner maintains definitions and freshness checks. The media owner interprets campaign signals. The business owner approves material budget or target changes. The technical owner maintains connectors, permissions, and failure handling. Shared responsibility without a named accountable person is usually no responsibility.
How Practitioners Know the Dashboard Is Working
A dashboard is successful only if it changes decisions in a traceable way. Measure the operating loop, not vanity engagement with the report. A monthly review should examine whether alerts led to better prioritization, whether recommendations were accepted or rejected for documented reasons, and whether changes were later reversed because the evidence was weak.
The validation loop
- Observe: capture the signal with freshness, definition, and comparison context.
- Diagnose: follow the prescribed drill-down and record the suspected cause.
- Decide: choose hold, investigate, recommend, approve, or execute.
- Annotate: record the change, owner, timestamp, and expected outcome.
- Recheck: evaluate the relevant mature period, not merely the next refresh.
- Revise: adjust the threshold, definition, or workflow if the signal repeatedly produces poor decisions.
For every alert type, define a falsifiable success condition. A budget-pacing alert might be considered useful if it leads to a documented decision before the period closes. A tracking alert might be useful if it identifies a real measurement break without causing unnecessary campaign edits. A search-term alert might be useful if reviewed query themes produce a documented negative-keyword, landing-page, or campaign-structure decision.
Do not judge the system only by how many alerts it produces or how quickly someone opens a report. Review:
- Percentage of high-severity alerts with an owner and decision.
- Time from detection to qualified diagnosis.
- Rate of recommendations rejected because of stale or incorrect data.
- Number of changes lacking a rollback record.
- Repeated alerts that never lead to action.
- Whether threshold changes are supported by observed false positives and misses.
Use a small change review for material edits. Before execution, show the current value, proposed value, affected campaigns, reason, expected direction, and rollback. Afterward, compare the outcome with the prediction and note confounders such as promotions, seasonality, tracking releases, or auction changes. This creates institutional memory for agencies managing many accounts and for internal teams handing work between specialists.
Use external sources to validate, not decorate
Official documentation should resolve platform mechanics that a dashboard label cannot. Google’s reporting and metrics guidance can clarify what a field means, while the Google Ads API documentation can clarify how resource and segment combinations affect query results. For cross-channel teams, Meta’s official Marketing API Insights documentation describes the insights endpoint and its breakdown-oriented reporting model: Meta Marketing API Insights documentation. That distinction matters when a unified dashboard tries to compare Google and Meta metrics that have different attribution, breakdown, and data-availability behavior.
Analytics freshness also deserves a source-specific check. Google’s Analytics Data API documentation explains how reports are requested and what dimensions and metrics can be queried: Google Analytics Data API documentation. Use that documentation when reconciling analytics events with advertising conversions, rather than assuming that similarly named fields are interchangeable.
For search visibility or landing-page diagnostics, keep Google Search Console separate from paid-search performance even when both appear in one workspace. Search Console documents its performance report around search results data and dimensions such as query, page, country, and device: Google Search Console performance report documentation. Organic impressions can provide context for demand, but they are not paid impressions and should not be blended into paid-media efficiency calculations.
Specific Recommendation for a 2026 Operating Model
Build one role-based Google Ads dashboard with four linked views: owner control, operator queue, analyst diagnosis, and governance. Start with five decisions—budget, tracking trust, traffic relevance, bidding safety, and business reporting—and give each a freshness rule, metric definition, threshold policy, drill-down path, action, and accountable owner.
Keep the first release deliberately narrow. A credible dashboard with mature definitions and a working change log is more valuable than a broad dashboard full of unowned alerts. Add automation only after the validation loop shows that the underlying signal reliably changes a decision. For AI-assisted workflows, make recommendations explainable and execution approval-gated, with reversible changes and an audit trail.
NotFair can help teams connect approved AI workflows to advertising and analytics systems through hosted MCP servers; explore NotFair when you want the dashboard’s diagnosis to lead into controlled, reviewable action rather than another disconnected report.
Authored with NotFair SEO