

Google Ads cost is the amount your account pays for eligible ad interactions, usually clicks, impressions, or conversions depending on the campaign and bidding setup. It is not the same as a budget, a bid, a cost per acquisition, or the total cost of acquiring a customer. For managers, agencies, and in-house growth teams, the useful question is not simply “How much does Google Ads cost?” It is which auction and business conditions produced this spend, and did the resulting traffic create enough value?
What Google Ads Cost actually means
There are four related numbers that are routinely mixed together in reporting:
- Budget: the spending policy you give a campaign, such as an average daily budget.
- Bid: the maximum amount, target, or optimization signal used to compete for an opportunity.
- Spend: the amount Google records as advertising cost for the selected date range.
- Unit economics: the cost per click, lead, sale, or revenue dollar generated by that spend.
A campaign can have a $100 illustrative daily budget and spend less because eligible traffic is limited. It can also spend more than the stated amount on one day while averaging around the daily budget over the relevant billing period, depending on Google’s delivery rules and campaign type. Treat any budget figure as a control policy, not as a guaranteed invoice amount. Google explains how average daily budgets and monthly charging limits work in its official budget documentation.
Spend is an output of eligibility, auctions, delivery, and billing. A keyword does not have a permanent price attached to it. Each eligible search creates a new opportunity, and the price paid depends on the competing ads, the auction context, the ad and landing-page experience, and the bid strategy. The same advertiser can therefore see different costs for the same keyword across locations, devices, times, audiences, and query types.
Cost per click is not the same as cost per result
For a click-based campaign, average CPC is commonly calculated as:
Average CPC = total spend ÷ clicks
That number is useful for diagnosing traffic acquisition, but it does not tell you whether the traffic was commercially productive. A $4 CPC may be excellent for a profitable enterprise lead and unacceptable for a low-margin ecommerce product. To connect media cost to an outcome, use at least one downstream measure:
- Cost per lead = spend ÷ qualified leads, not merely form submissions.
- Cost per acquisition = spend ÷ completed purchases or other defined conversions.
- Return on ad spend = conversion value ÷ spend.
- Marginal cost = additional spend ÷ additional conversions or contribution margin created.
These calculations depend on what is counted as a conversion. A phone-click conversion, an imported CRM opportunity, and a closed-won customer are different events with different economic value. If the account optimizes toward a cheap but weak event, the platform can appear efficient while the sales pipeline deteriorates.
Illustrative cost examples
The following examples are deliberately hypothetical starting points, not industry benchmarks or forecasts:
- A search campaign spends $1,200 and produces 300 clicks. Average CPC is $4. If 12 qualified leads result, cost per qualified lead is $100.
- A second campaign spends $1,200 and produces 150 clicks. Average CPC is $8. If 24 qualified leads result, cost per qualified lead is $50. The more expensive traffic is economically better.
- An ecommerce campaign spends $2,000 and records $8,000 in attributed revenue. Its reported ROAS is 4.0, but profitability still depends on gross margin, fulfillment, returns, discounts, and customer acquisition overhead.
- A lead campaign reports 40 form fills at $30 each. If only 10 become sales-accepted opportunities, the meaningful cost is $120 per sales-accepted opportunity, not $30 per form.
Why costs change from one auction to the next
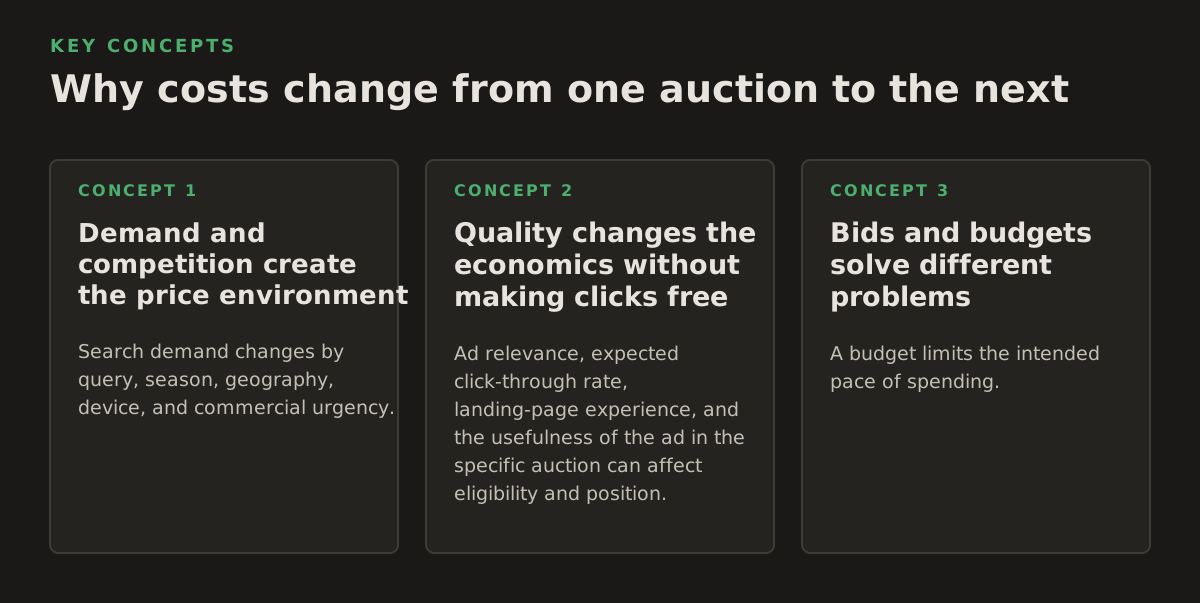
Google Ads is an auction system, so cost is shaped by both your account and the other advertisers eligible for the same opportunity. Google’s explanation of how the ad auction works describes the role of factors such as bid, ad quality, auction context, and the expected impact of ad assets. The practical implication is important: increasing a bid does not create demand, and reducing a bid does not necessarily preserve the same volume.
Demand and competition create the price environment
Search demand changes by query, season, geography, device, and commercial urgency. “Enterprise data warehouse consultant” and “data warehouse tutorial” may contain overlapping words but represent different buying situations. The first can attract intense commercial competition; the second may be primarily informational. Match type, search terms, negative keywords, and landing-page relevance determine how much of that demand your campaign can access.
Competition also varies within one keyword. A search made in a major business district during working hours may attract different advertisers than the same query made elsewhere at night. Auction-level conditions can affect:
- Whether the ad is eligible to enter the auction.
- Where the ad appears relative to other eligible ads.
- How much traffic is available at the chosen bid or target.
- The price of a click or impression when the ad wins.
- The conversion rate after the click, because intent and context vary.
Quality changes the economics without making clicks free
Ad relevance, expected click-through rate, landing-page experience, and the usefulness of the ad in the specific auction can affect eligibility and position. Better relevance is not a coupon that guarantees a low CPC. It can improve the chance of competing effectively, but a highly commercial query may remain expensive because many valuable businesses want that traffic.
Do not use Quality Score as a replacement for financial analysis. It is a diagnostic indicator at the keyword level, while your real decision may concern profit by product, lead quality by campaign, or revenue by customer cohort. A keyword with a middling diagnostic score can still be valuable if it produces profitable customers. A keyword with an excellent score can still lose money if the offer, qualification process, or close rate is poor.
Bids and budgets solve different problems
A budget limits the intended pace of spending. A bid or target controls how aggressively the system seeks opportunities under the selected strategy. Raising a budget can unlock more eligible demand; raising a bid can help the campaign compete for more opportunities or more valuable placements. Neither action fixes bad conversion tracking or weak economics.
Before changing either one, identify the constraint:
- Budget-constrained: profitable opportunities are available, but the campaign is limited by its spending policy.
- Rank-constrained: the campaign is eligible but rarely competitive at its current bid and ad quality.
- Demand-constrained: there are not enough relevant searches or impressions in the target market.
- Conversion-constrained: clicks arrive, but the landing page, offer, qualification, or sales process fails.
- Measurement-constrained: the account cannot distinguish valuable outcomes from low-value interactions.
These constraints look similar in a top-line dashboard. A campaign with low spend and few conversions might need more budget, or it might simply be targeting a tiny audience with an unattractive offer. Spending more is not a diagnosis.
How Google calculates and reports the economics
The account’s reported cost is assembled from interactions and billing records, while your business dashboard usually combines those records with conversion and revenue data. Those layers do not always align on the same date. A click may happen today, a conversion later, and a CRM status change weeks after that. Comparing spend by click date with closed revenue by close date can create apparent volatility that is actually a reporting-window mismatch.
Separate interaction cost from conversion value
Google’s documentation distinguishes payment models and explains that actual CPC can be lower than the maximum CPC bid in relevant auction situations; see the official CPC guidance. The operational lesson is to analyze the amount charged, not the ceiling configured in the interface.
For a clean weekly or monthly review, define the reporting grain before calculating performance:
- Use one consistent time zone and date range.
- Separate campaign cost from agency fees, creative production, discounts, and sales labor.
- State whether conversions are reported by interaction date or conversion date.
- Use the same conversion definition when comparing campaigns.
- Check whether revenue is gross sales, net sales, booked revenue, or contribution margin.
For lead generation, the strongest setup usually passes meaningful offline stages back into the advertising system rather than treating every initial inquiry as equal. That does not mean every account needs a complicated data warehouse. It means the optimization event should resemble the business outcome closely enough to guide bidding in the right direction.
Why attribution can change the apparent answer
One conversion can be influenced by several channels, campaigns, or interactions. A Google Ads report may assign value according to its selected attribution and conversion settings, while analytics, a CRM, and finance may use different rules. A campaign can therefore show a favorable reported CPA without being the sole source of demand.
This is especially important when assessing branded search. Brand campaigns often capture people who already know the company. Their direct-response metrics may be strong, but the incremental value of those clicks is a separate question. If you want to test incrementality, compare carefully defined geographies, audiences, or time periods and control for other changes. Do not infer incremental revenue from platform attribution alone.
Use the Google Ads API for repeatable diagnosis
Manual interface checks are useful for investigation, but agencies and teams managing multiple accounts need reproducible data. Google’s Google Ads API reporting documentation describes querying account entities and performance data through the API. A practical reporting model can join campaign cost, search terms, conversion actions, auction diagnostics, landing-page data, and CRM stages.
That data model should preserve the raw fields rather than only storing calculated CPA. Otherwise, a later change in conversion definition can make historical comparisons impossible. Store:
- Account, campaign, ad group, keyword, and search-term identifiers.
- Date, device, location, network, and conversion action.
- Impressions, clicks, cost, conversions, conversion value, and interaction metrics.
- Bid strategy and budget settings at the time of observation.
- CRM outcome, revenue, margin, and status timestamps where available.
Automation should explain a change before executing it. A script that raises budgets whenever CPA falls below a threshold can scale a temporary brand spike, a tracking error, or a small sample. A better system checks sample size, conversion lag, spend pacing, inventory or capacity, and the approval policy before proposing an edit.
Where Google Ads Cost analysis breaks
Most bad cost decisions are not caused by difficult arithmetic. They come from treating an unstable measurement system as if it were a cash register. The number may be accurate for the selected platform definition and still be unsuitable for the business decision.
Conversion tracking can create false efficiency
Common failure modes include duplicate tags, imported conversions counted alongside their source events, calls recorded without qualified outcomes, and forms submitted by existing customers. Consent settings, browser behavior, cross-domain navigation, and offline imports can also affect observed conversions. The exact technical impact depends on the implementation, so investigate the event path rather than applying a universal correction factor.
Run a conversion audit whenever performance changes abruptly without a matching business explanation. Check:
- Whether the conversion action is still recording.
- Whether the tag fires once and on the intended success event.
- Whether primary and secondary actions are configured appropriately.
- Whether imported offline events retain the correct identifiers and timestamps.
- Whether the CRM confirms the same count and status as the ad platform.
Google provides technical guidance for conversion tracking troubleshooting. Treat platform-reported conversions as a data product that needs maintenance, not as an unquestionable ground truth.
Small samples invite expensive reactions
An illustrative campaign that spends $300 and produces two conversions has a reported CPA of $150. One additional conversion changes the CPA to $100; one rejected lead changes the business interpretation again. That volatility is not evidence that the campaign should be paused or scaled. It is evidence that the decision has limited information.
Use explicit policies for low-volume situations. For example, an agency might require a review of search terms and tracking before making a bid-strategy change when a campaign has fewer than 10 observed primary conversions in the selected evaluation window. That is an illustrative starting policy, not a universal statistical threshold. The correct policy depends on sales-cycle length, margin, conversion lag, and the cost of being wrong.
Blended averages hide useful differences
Account-level CPA can conceal a profitable product, an unprofitable location, or a search term that consumes budget without producing qualified demand. Segment before acting:
- Brand versus non-brand intent.
- New customer versus existing customer.
- Product or service line.
- Location, device, and hour of day.
- Search term intent and match-type behavior.
- Lead source, sales stage, and eventual revenue.
Segmentation has a trade-off. The more slices you create, the smaller each sample becomes and the more likely you are to chase noise. Start with segments that map to a real decision: exclude a poor service area, protect a high-margin product, adjust a landing page, or change lead qualification.
Platform cost is not total acquisition cost
Paid media is only one component of acquisition. A valid profitability model may include payment processing, discounts, returns, sales commissions, agency labor, creative production, software, fulfillment, and customer support. For a service business, the close rate and gross profit per customer may matter more than the initial lead CPA.
Build a contribution-margin ceiling before scaling. If an illustrative customer generates $2,000 in gross profit before marketing and the business requires $1,400 to cover non-media acquisition costs and desired contribution, the allowable media cost is not automatically $2,000. It is the amount left after those other requirements. The exact ceiling must come from the company’s economics, not from a generic account benchmark.
How practitioners apply cost analysis to campaigns
A useful operating rhythm moves from business economics to measurement, then to campaign mechanics. This prevents the common mistake of changing bids first and asking what happened later.
Start with a value model
For ecommerce, use product-level margin or contribution value where possible instead of treating every dollar of revenue as equal. For lead generation, estimate expected value using stage rates:
Expected customer value per lead = lead-to-opportunity rate × opportunity-to-customer rate × gross profit per customer
Suppose an illustrative funnel turns 20% of leads into opportunities, 25% of opportunities into customers, and produces $3,000 in gross profit per customer. Expected gross profit per lead is $150 before sales and media costs. A target lead cost must leave room for those costs and for uncertainty. This calculation is more defensible than selecting a target CPA because another account uses it.
Diagnose before changing the account
Use a decision sequence like this:
- Validate the data: confirm spend, primary conversions, conversion lag, duplicate events, and CRM alignment.
- Identify the constraint: budget, rank, demand, conversion rate, or measurement.
- Locate the loss: search terms, landing pages, products, locations, devices, or sales stages.
- Choose one reversible intervention: negative keyword, ad revision, landing-page change, budget adjustment, audience exclusion, or conversion-setting correction.
- Define the observation window: state when the change will be reviewed and what evidence would justify keeping or reversing it.
- Record the hypothesis: explain why the change should improve economics and what result would falsify that belief.
The “one intervention” rule is not absolute. A broken tracking tag should be fixed immediately, and a legally or commercially unacceptable query should be excluded promptly. But changing bids, budgets, targeting, ads, landing pages, and conversion actions at once makes it difficult to learn which mechanism mattered.
Use controls that match the problem
| Observed pattern | Likely question | First action to consider |
|---|---|---|
| High spend, low qualified-lead rate | Are queries and landing pages aligned with the offer? | Review search terms, qualification, and landing-page intent. |
| Low spend, strong efficiency, stable capacity | Is demand available but the campaign constrained? | Model incremental volume before increasing budget. |
| Low CPC, weak revenue | Is cheap traffic coming from low-intent queries or weak placements? | Evaluate downstream quality, not CPC alone. |
| High reported conversion rate, weak CRM outcomes | Is the optimization event too shallow or duplicated? | Reconcile conversion actions with CRM stages. |
| Sudden CPA change with flat business demand | Did tracking, attribution, auction mix, or conversion lag change? | Audit data and segment performance before editing bids. |
Automate the repetitive work, not the judgment
AI and automation are useful when they reduce inspection time without hiding uncertainty. A monitoring agent can pull daily cost and conversion data, identify outliers, compare them with historical baselines, and draft a diagnosis. It can also check whether a proposed budget change would violate a client’s approval rule or exceed a pacing policy.
Execution should remain bounded:
- Require approval for budget, targeting, bidding, and conversion-setting changes.
- Limit edits to named campaigns and explicit parameter ranges.
- Store the previous value and reason for every change.
- Use automatic rollback when a defined safety condition is breached.
- Keep a human review path for unusual spend, tracking anomalies, or business-sensitive campaigns.
For teams building an AI workflow, a hosted Google Ads MCP can connect an approved client workflow to campaign data and actions without turning every diagnosis into an immediate edit. Cross-channel context can matter too: reviewing a Meta Ads MCP alongside Google performance may reveal that a platform-level CPA change is actually a budget allocation or audience-overlap issue.
A practical recommendation for managing cost in 2026
Set targets from contribution economics, report platform spend separately from total acquisition cost, and make every optimization answer a named constraint. Do not ask an automated system to “lower Google Ads cost” as an unconstrained objective. Ask it to preserve qualified volume, stay within a defined margin or CPA ceiling, protect capacity, and explain the evidence behind each proposed change.
A disciplined weekly review can be concise:
- Check pacing against the approved budget policy.
- Reconcile spend and primary conversions with analytics and CRM data.
- Inspect search terms and segments that changed the account-level result.
- Separate auction or demand changes from landing-page and sales-process changes.
- Approve only reversible edits with a stated hypothesis and review date.
That approach makes cost a controllable business variable rather than a vanity metric. NotFair provides hosted, approval-gated MCP connections for advertising and analytics workflows, so teams can move from diagnosis to reversible action with the relevant evidence in view: NotFair.
Authored with NotFair SEO